Depression Worldwide
← Back
GitHub Repository
Project: "STUDENTS AND CHOOSING MAJORS"
Part 2. Statistical Data Analysis
Authors:
Introduction
A major is the focus of your degree program, representing a specific subject area in which you choose to specialize. Some examples of the most popular majors in Canada include business, engineering, and health. Depending on the university, students may select their major at the beginning or after a year of study. The choice of major is influenced by various factors, such as personal interests, future career aspirations, salary expectations, and the desired industry of employment.
Choosing a major can be frustrating! Currently, more students attend university than ever. However, existing data suggest that many of them start university being uncertain about what major fits them. Many students might get discouraged and end up dropping out or having poor mental health. Therefore, having a good understanding of the different options and possibilities can help students make informed decisions about their majors, aligning their passions with their career goals. In this project, we aim to explore the popularity of different majors and the associated salary and unemployment rates. Our dataset was collected by FiveThirtyEight and represents the population of university students, including both males and females. By analyzing this data, we hope to help students to better understand the differences of majors in terms of unemployment rate, salary, and gender. Therefore, we aim to help students choose a major that aligns with their interests, career objectives, and desired salary
Guiding questions
Is there a relationship between major categories and the unemployment rate?
What is the relationship between salary and different major categories?
Is there a relationship between female proportion in each major category and median salary?
Dataset:
For our project we use data from the dataset “College Majors and their Graduates” collected from Kaggle “College Majors and their Graduates”. This dataset contains a comprehensive selection of lavish data and processing scripts behind the articles, graphics, and interactive experiences generated by FiveThirtyEight. We have done a number of functions on the dataset such as Checking for NAs,Checking for Duplicates,Ensuring that the entire dataset has consistent Formatting.
License:
All this data is under the Creative Commons Attribution 4.0 International License and MIT License. The last update of the dataset was in November of 2022.
Code
Results
1. Is there a relationship between major categories and the unemployment rate?
Hypothesis
To make a conclusion about the difference of unemployment rate between different majors the next hypothesis is done:
$H_0$: There is no significant difference between in the unemployment rate between major categories
$H_A$: There is significant difference between in the unemployment rate between major categories
For checking the hypothesis it can be compared each major unemployment rate with the unemployment rates of all majors. To compare these variables, we used bootstrap statistics
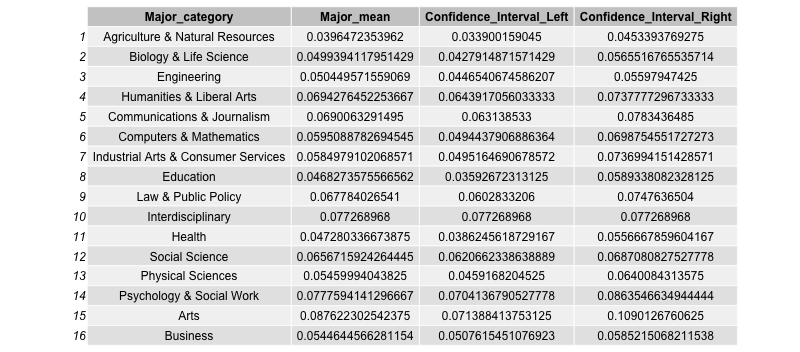
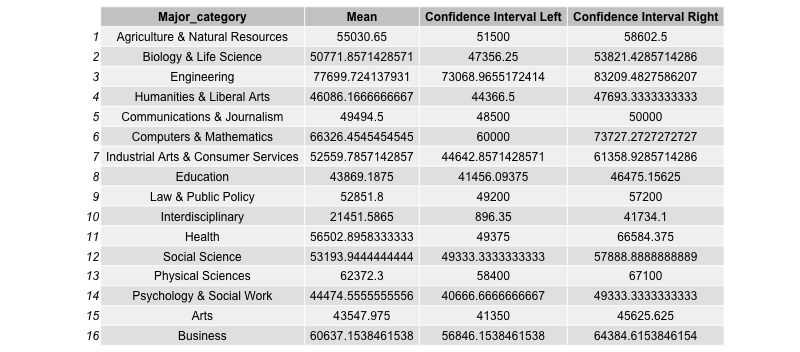
Bootstrap confidence intervals for the unemployment rate:
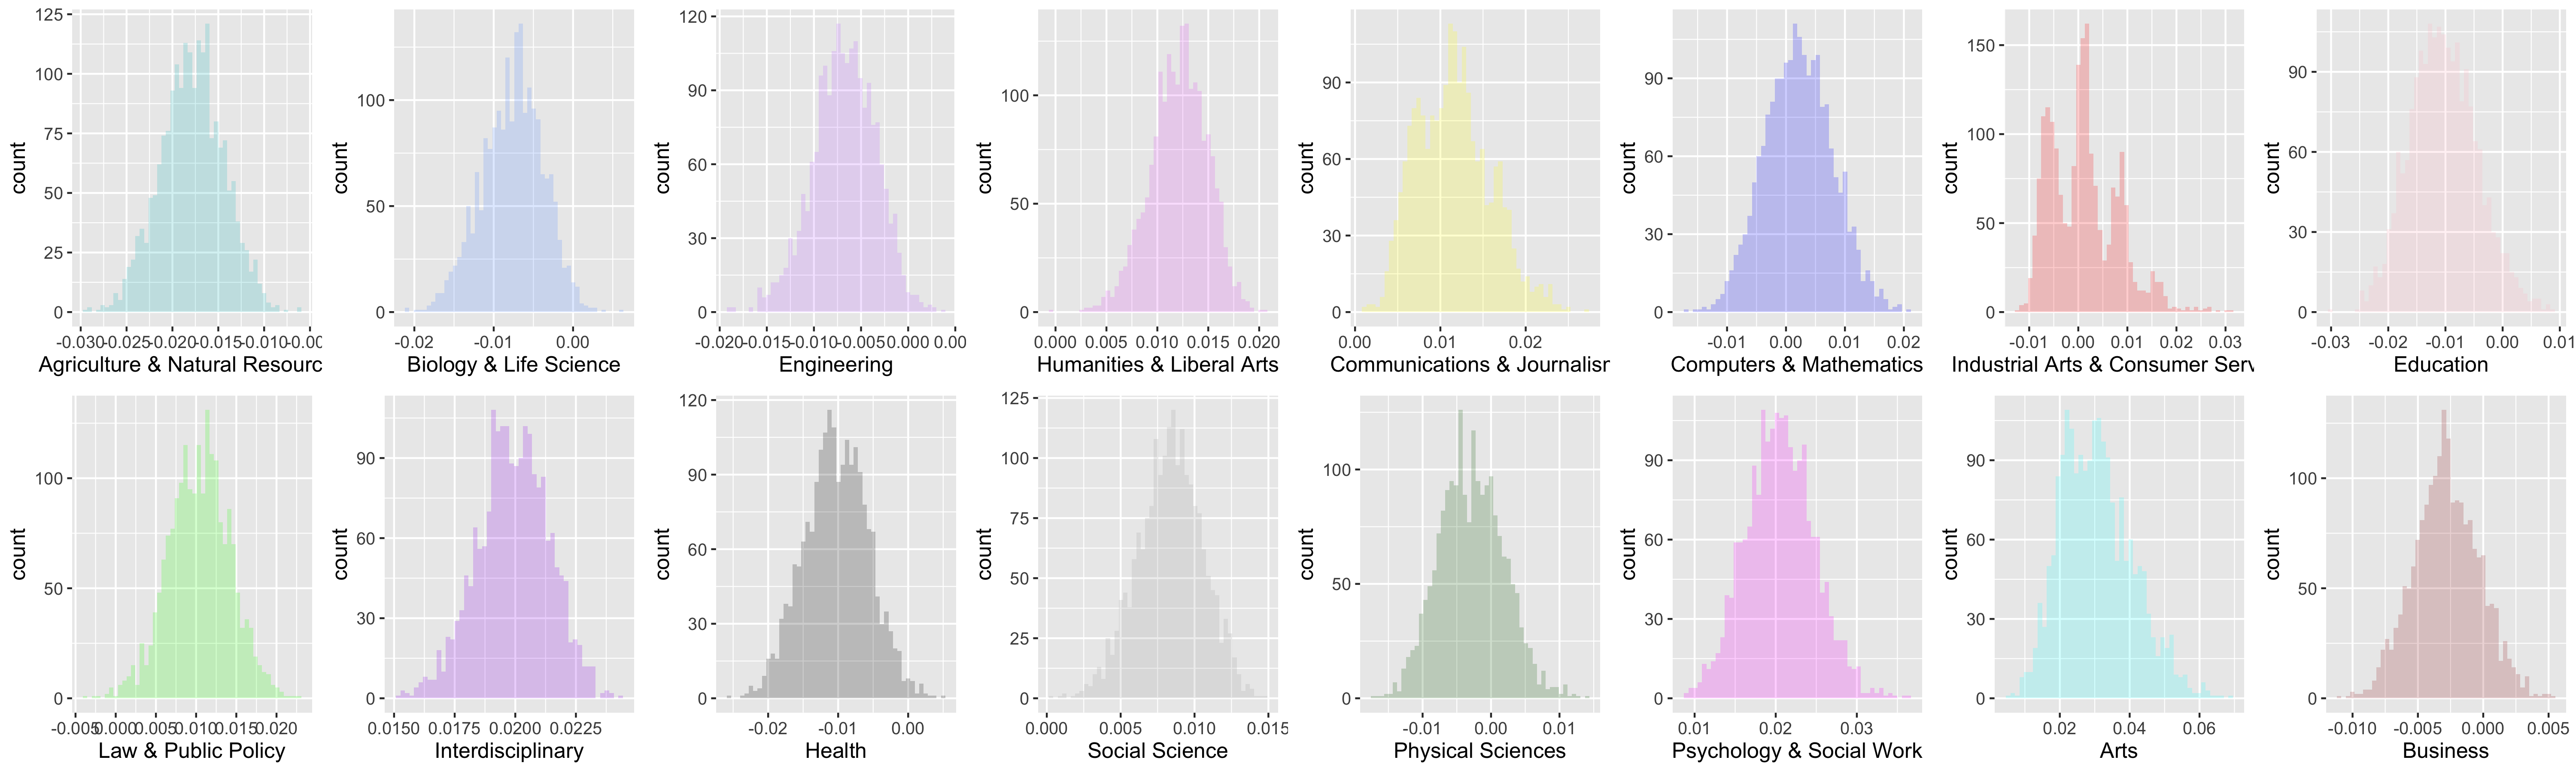
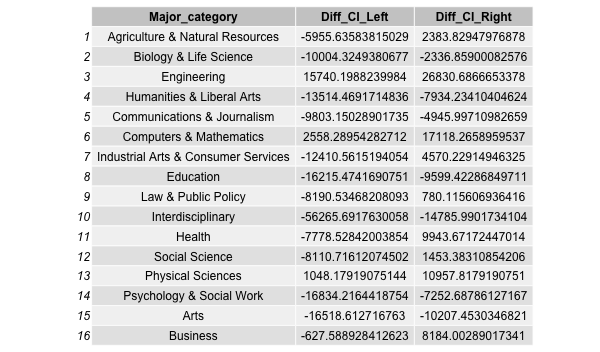
Bootstrap confidence intevals for differences of the mean unemployment rate and unemployment rate by category:
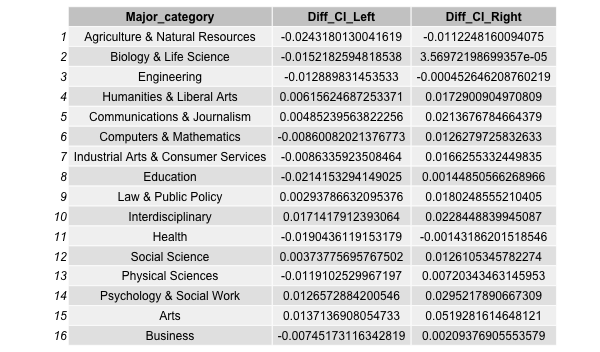
Based on data and graphs above, we can infer that in most of the Major categories the population mean does not fall into the confidence interval. We conclude that our null hypothesis is rejected. All major categories has their own unemployment rates.
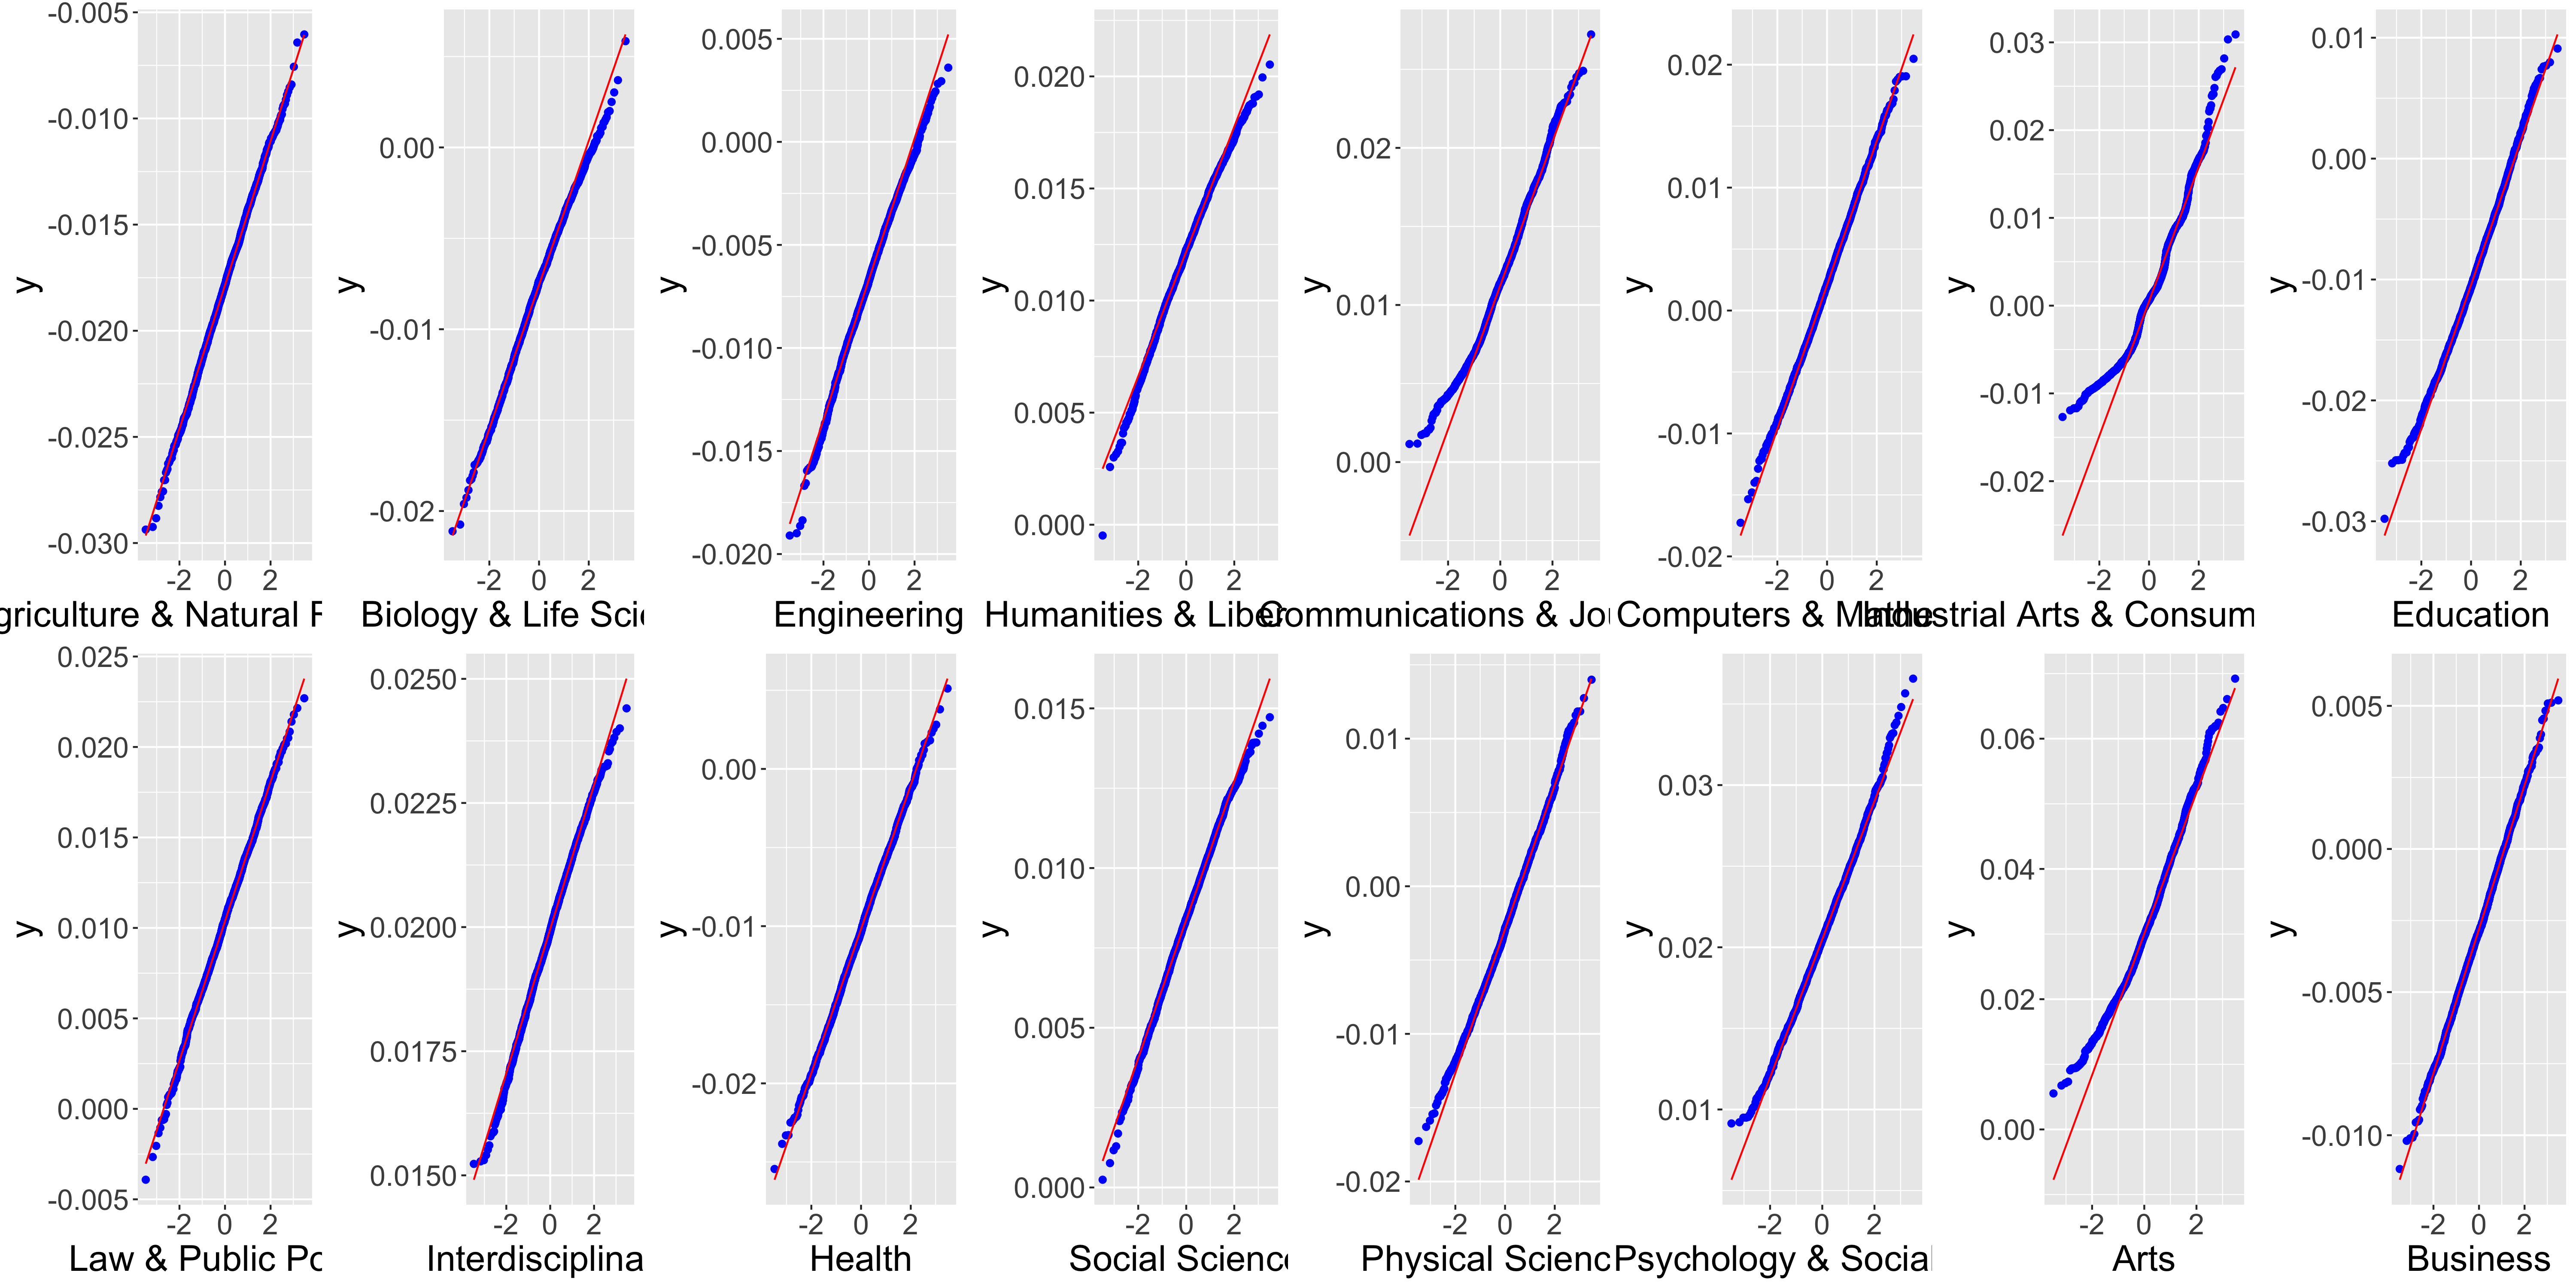
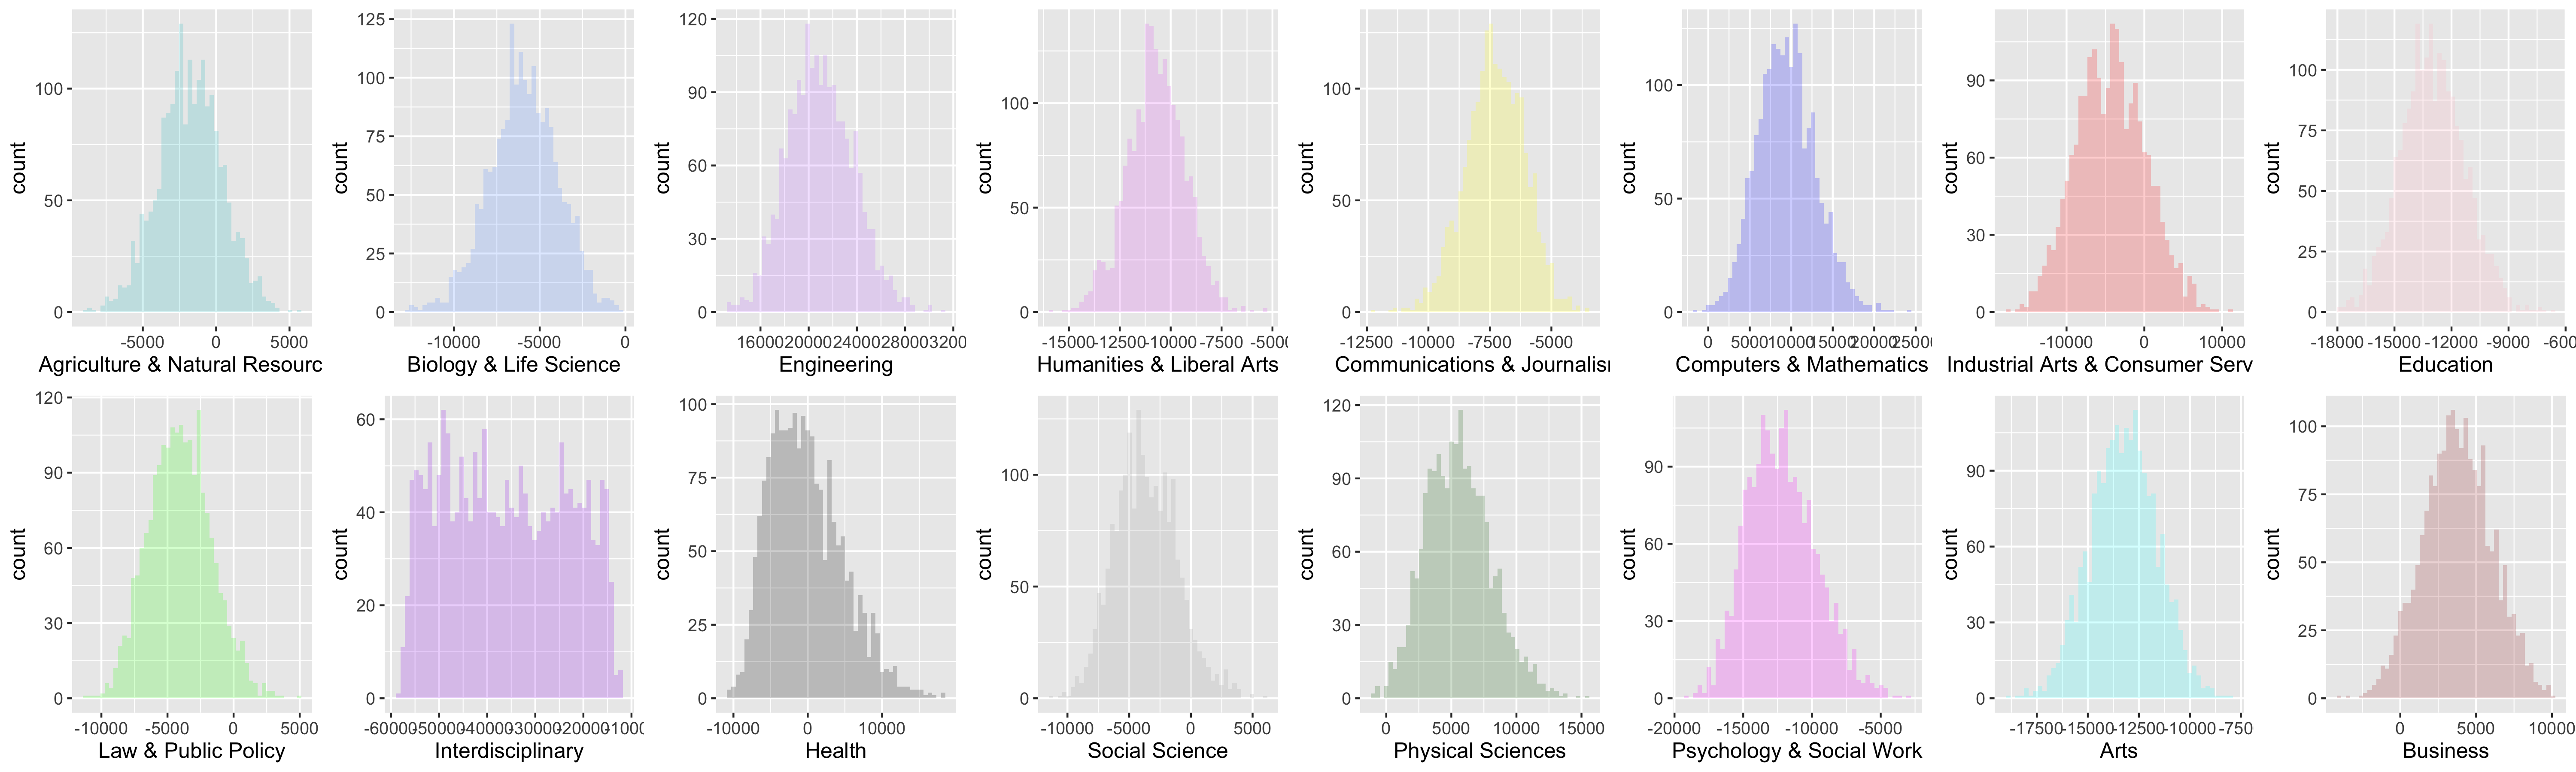
To examine whether we are confident about our data and to better understand the type of distributions, we created Normal Probability Plots for each difference in mean distribution.
To illustrate the variance of unemployment rate by major category the number of boxplots is illustrated bellow.
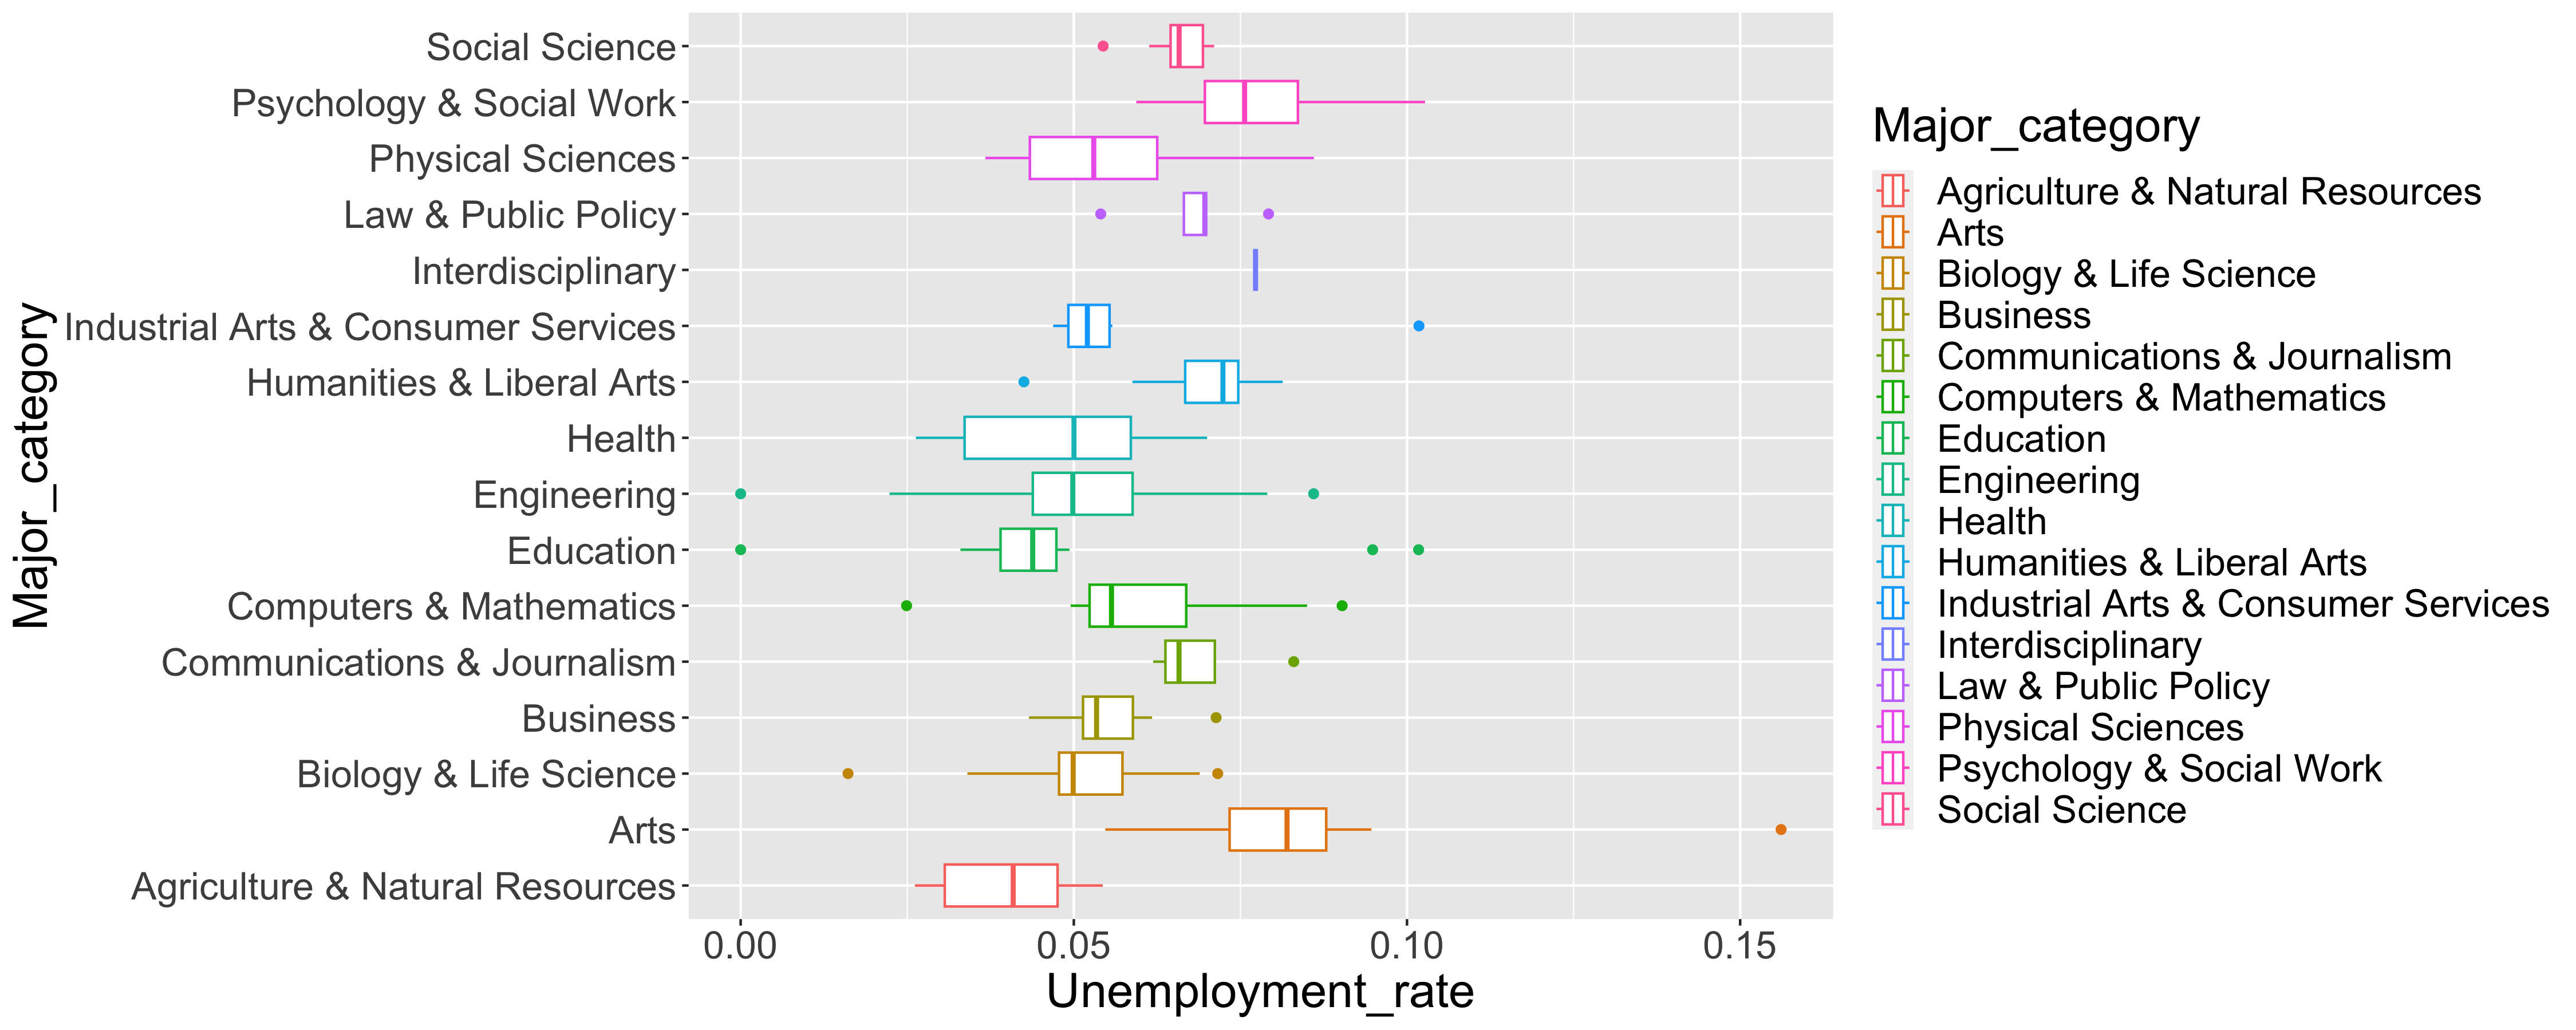
Based on the data presented, we can see that the unemployment rate for each major category falls within a range of 0.03-0.08. A closer analysis of the graph reveals that certain majors stand out. Specifically, graduates with degrees in Agriculture & Natural Resources and Education have the lowest unemployment rate, with an average of 0.03951. This indicates that students in these fields are more likely to secure employment after graduation. Conversely, the Arts major has the highest unemployment rate, with an average of 0.0877. This implies that graduates with degrees in the Arts face more difficulty in finding employment compared to their peers in other majors.
2. What is the relationship between salary and different major categories?
Hypothesis
To make a conclusion about the difference of salaries between different majors the next hypothesis is done:
$H_0$: There is significant difference between in the median salary between major categories
$H_A$: There is no significant difference between in the median salary between major categories
For checking the hypothesis it can be compared each major median salary with median salary of all majors. To compare these variables bootstrap can be used.
Bootstrap confidence intervals for the median salary:
Bootstrap confidence intevals for differences of the median salary by category:
To examine whether we are confident about our data and to better understand the type of distributions, we created Normal Probability Plots for each difference in mean distribution.
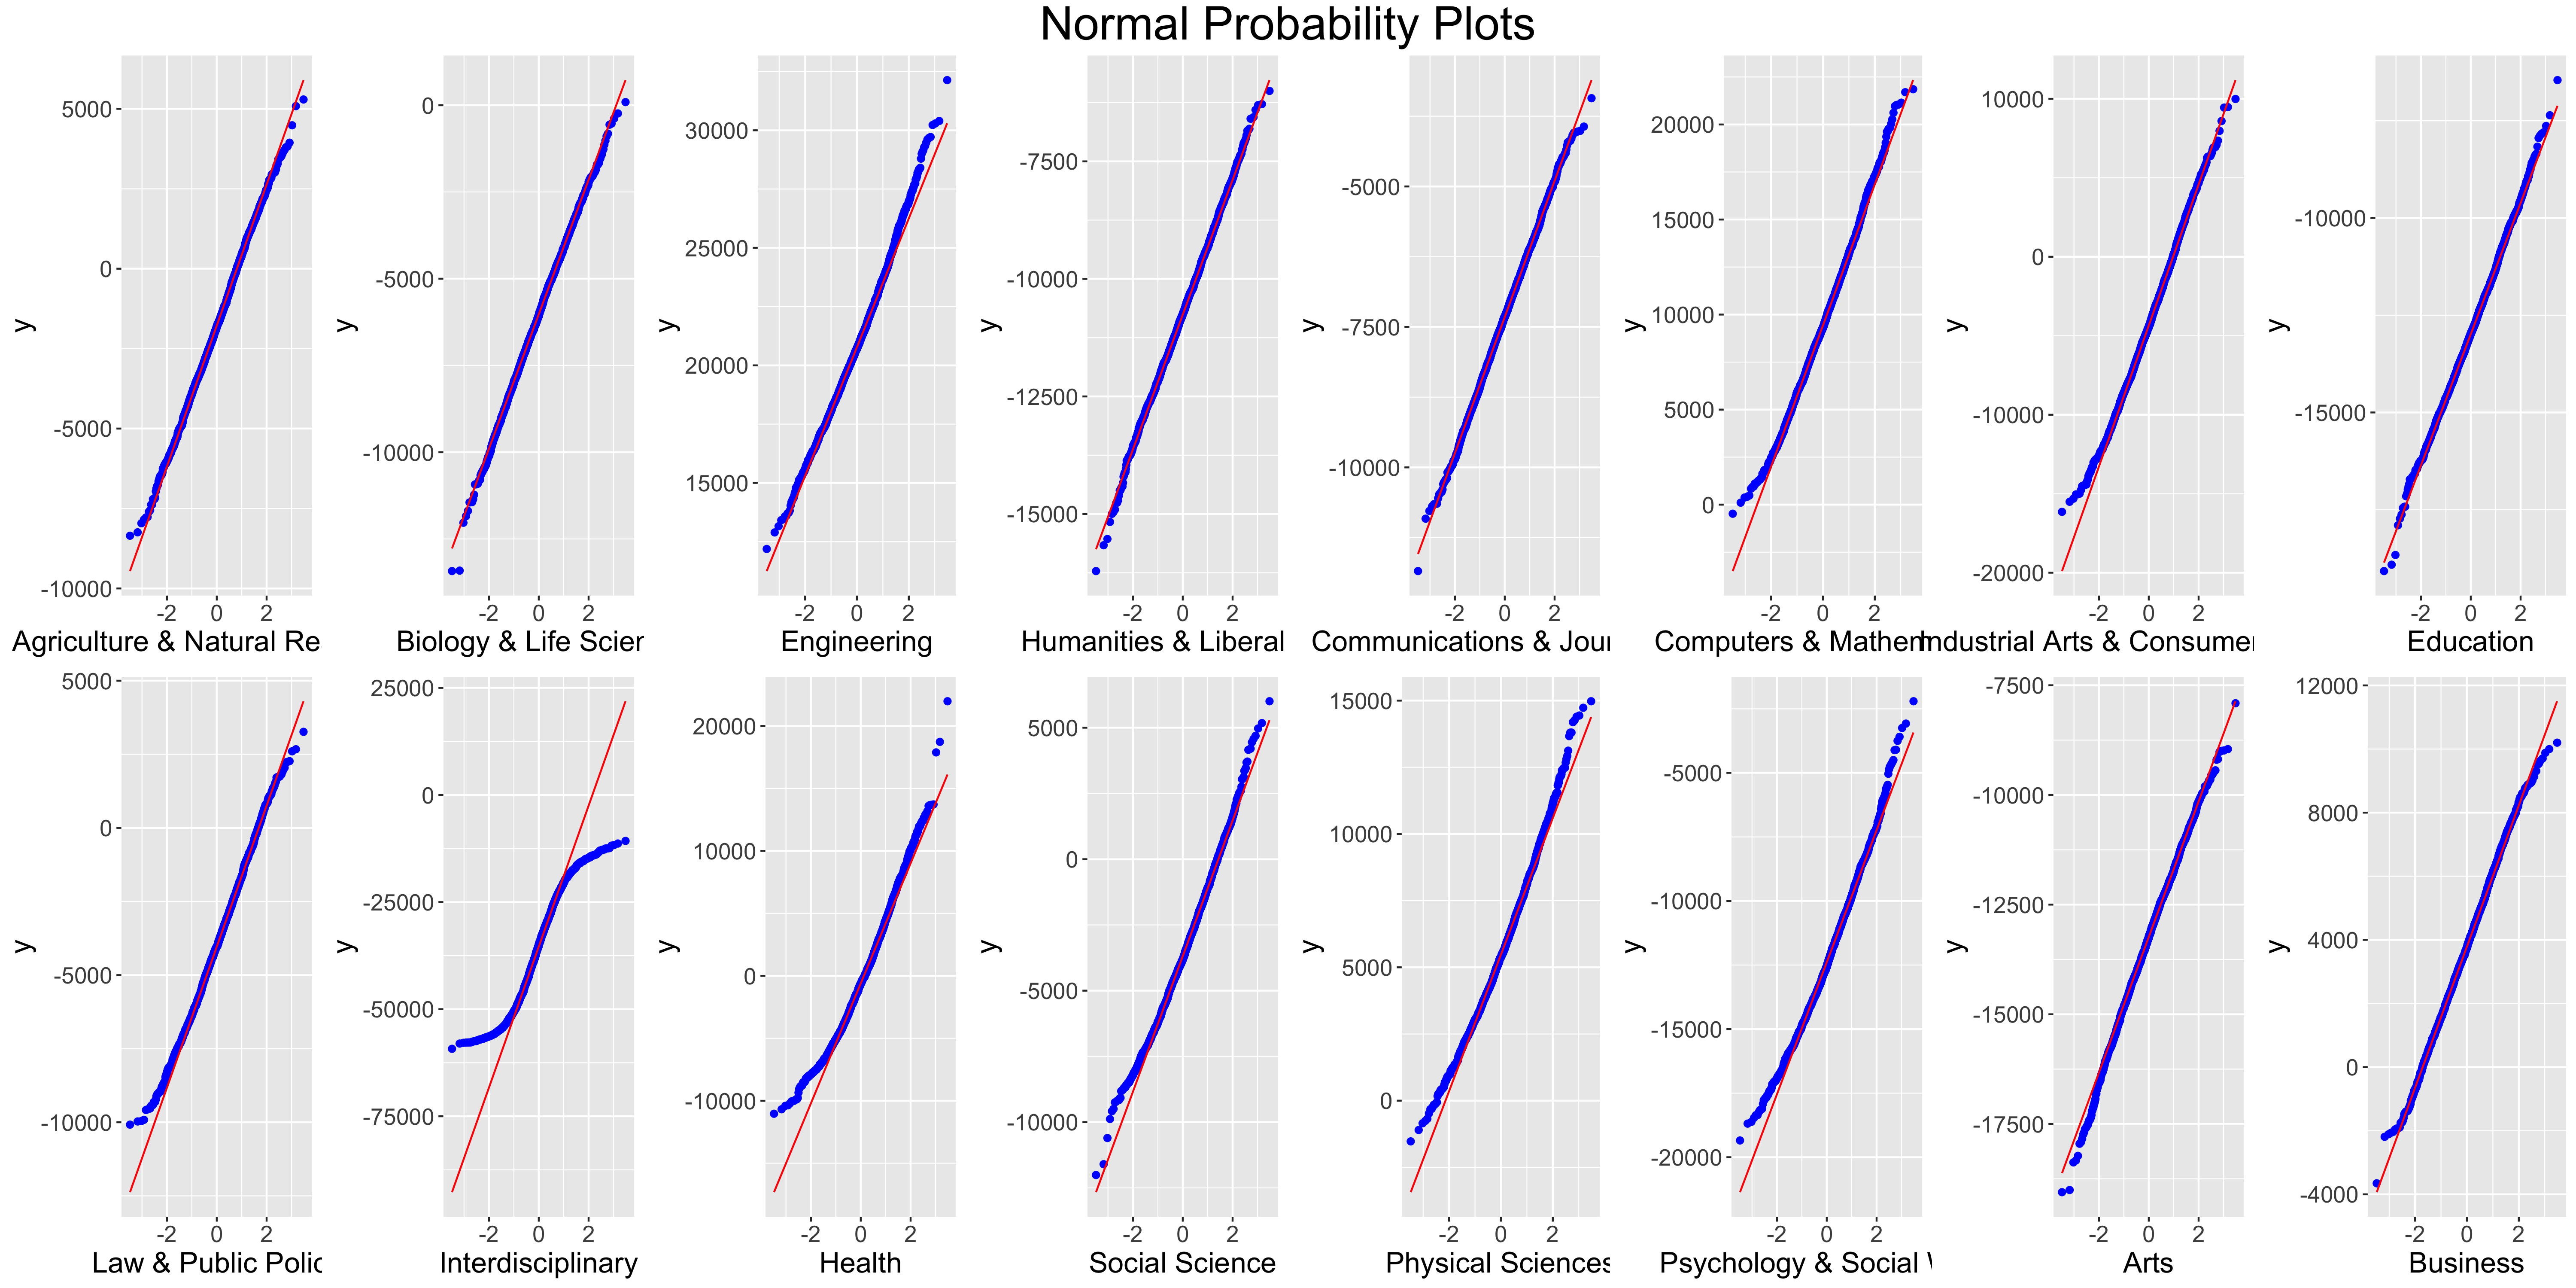
To illustrate the variance of unemployment rate by major category the number of boxplots is illustrated bellow.
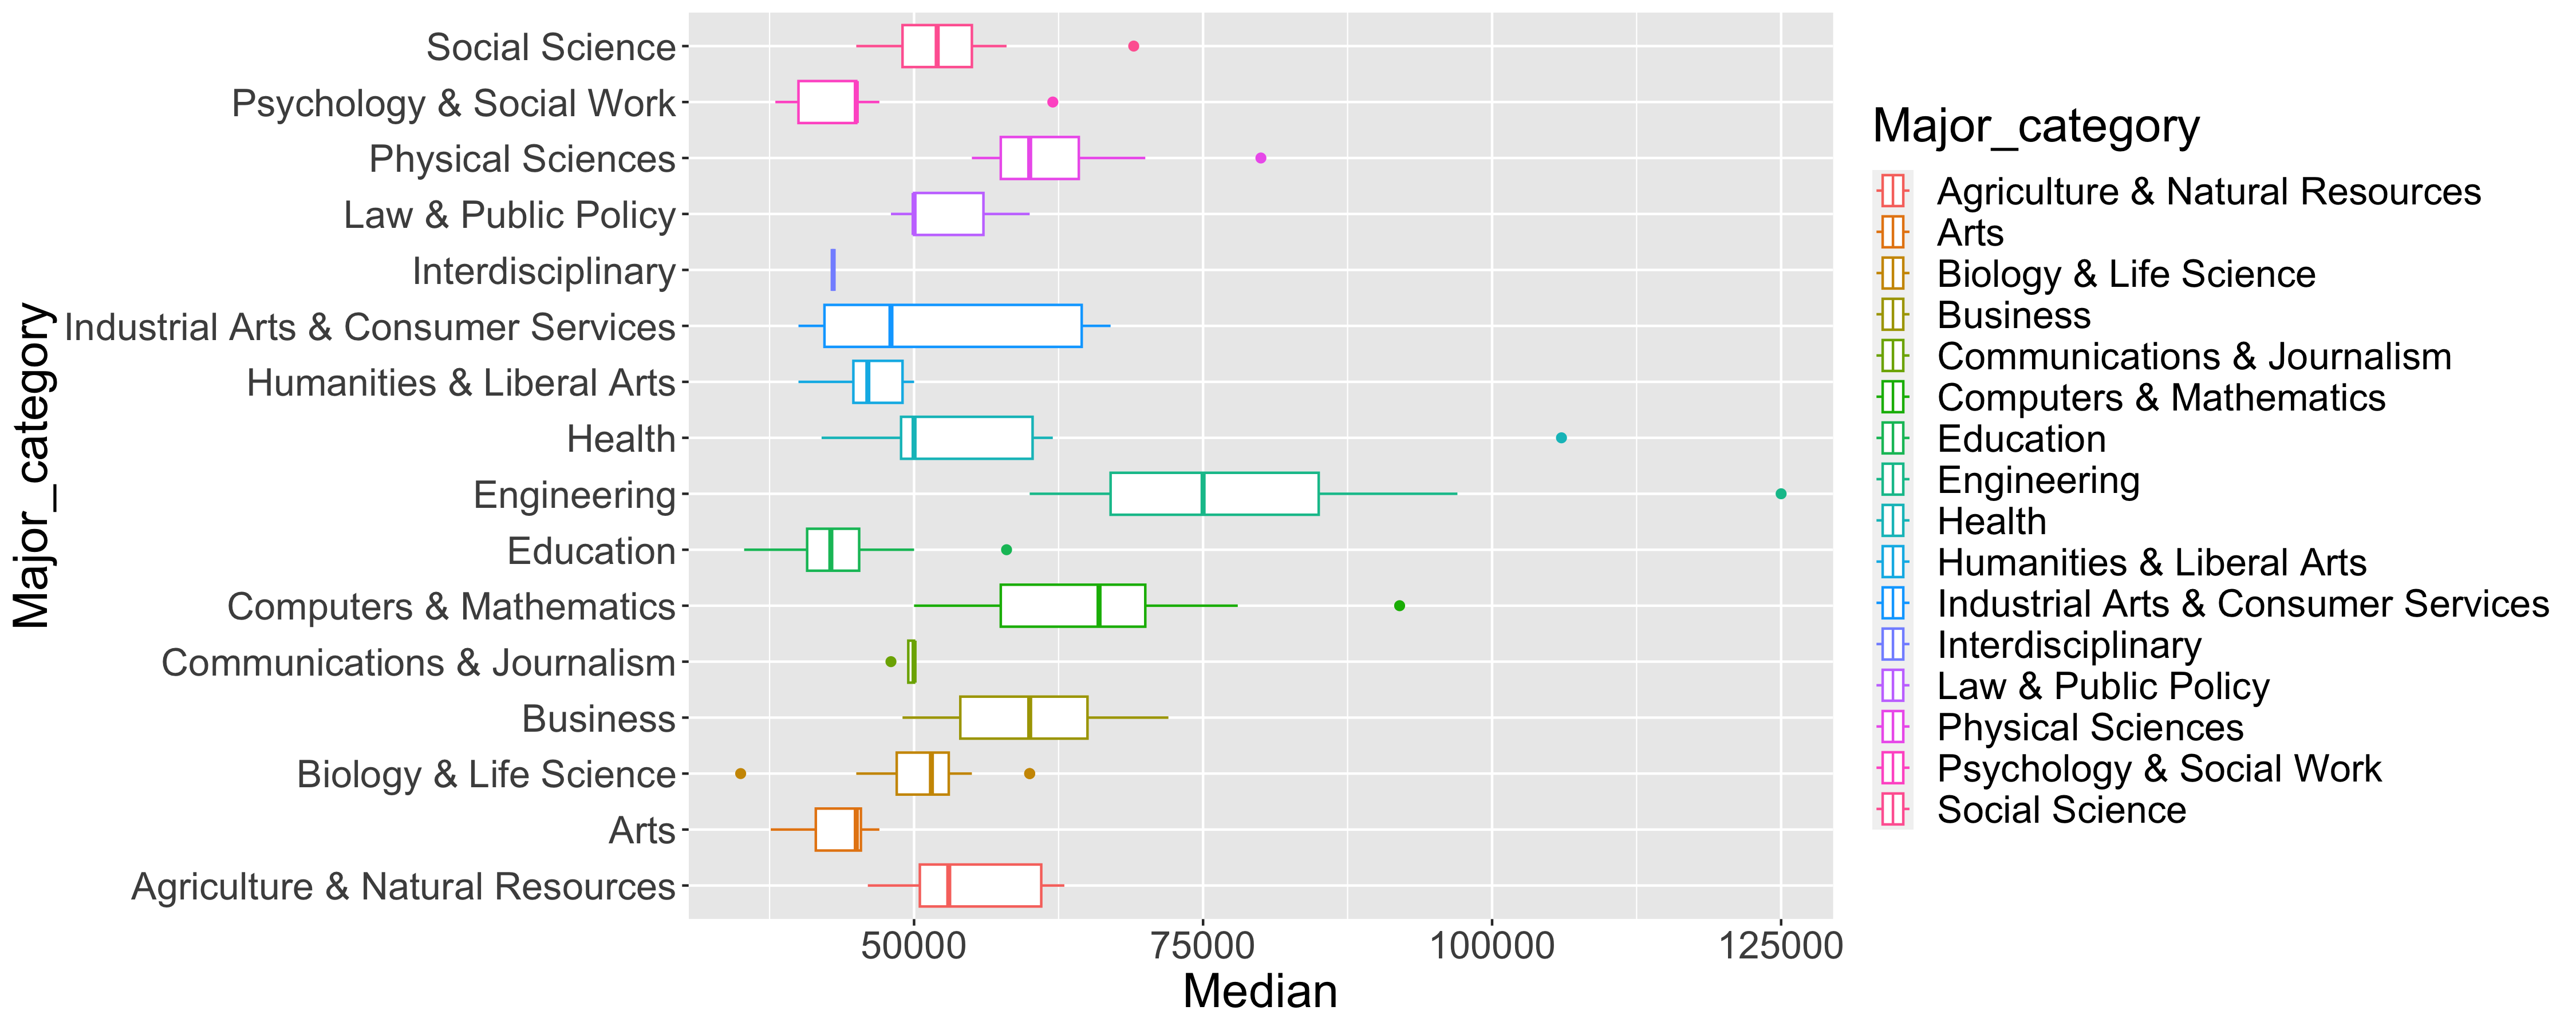
The null hypothesis is rejected. There is a significant difference in median salary between major categories. It means that people who study Engineering or Computer Science & Mathematics will have in general higher median salary then people who study Psycology or Arts. It can be important for them who are just decide what major to choose.
3. Is there a relationship between female proportion in each major category and median salary?
Hypothesis
$H_0$: Female proportion in each major does NOT impact median salary.
$H_A$: Female proportion in each major IMPACTS median salary.
To find the correlation coefficient values between female proportions and their median salary, we created a Matrix to store the values followed by a for loop to iterate over each majors.
Coefficient of correlation using data for all categories = -0.614711476104321
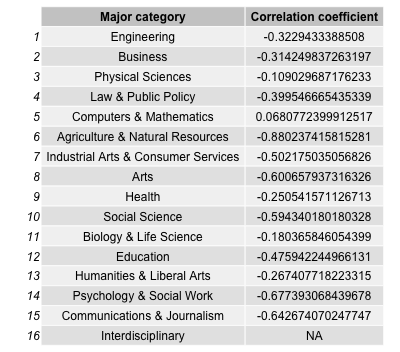
Now see the table that we created from the original dataset for our question. From which we can plot the graph to analyse in which major, female proportions have highest median salary and in which major women have lowest median salary.
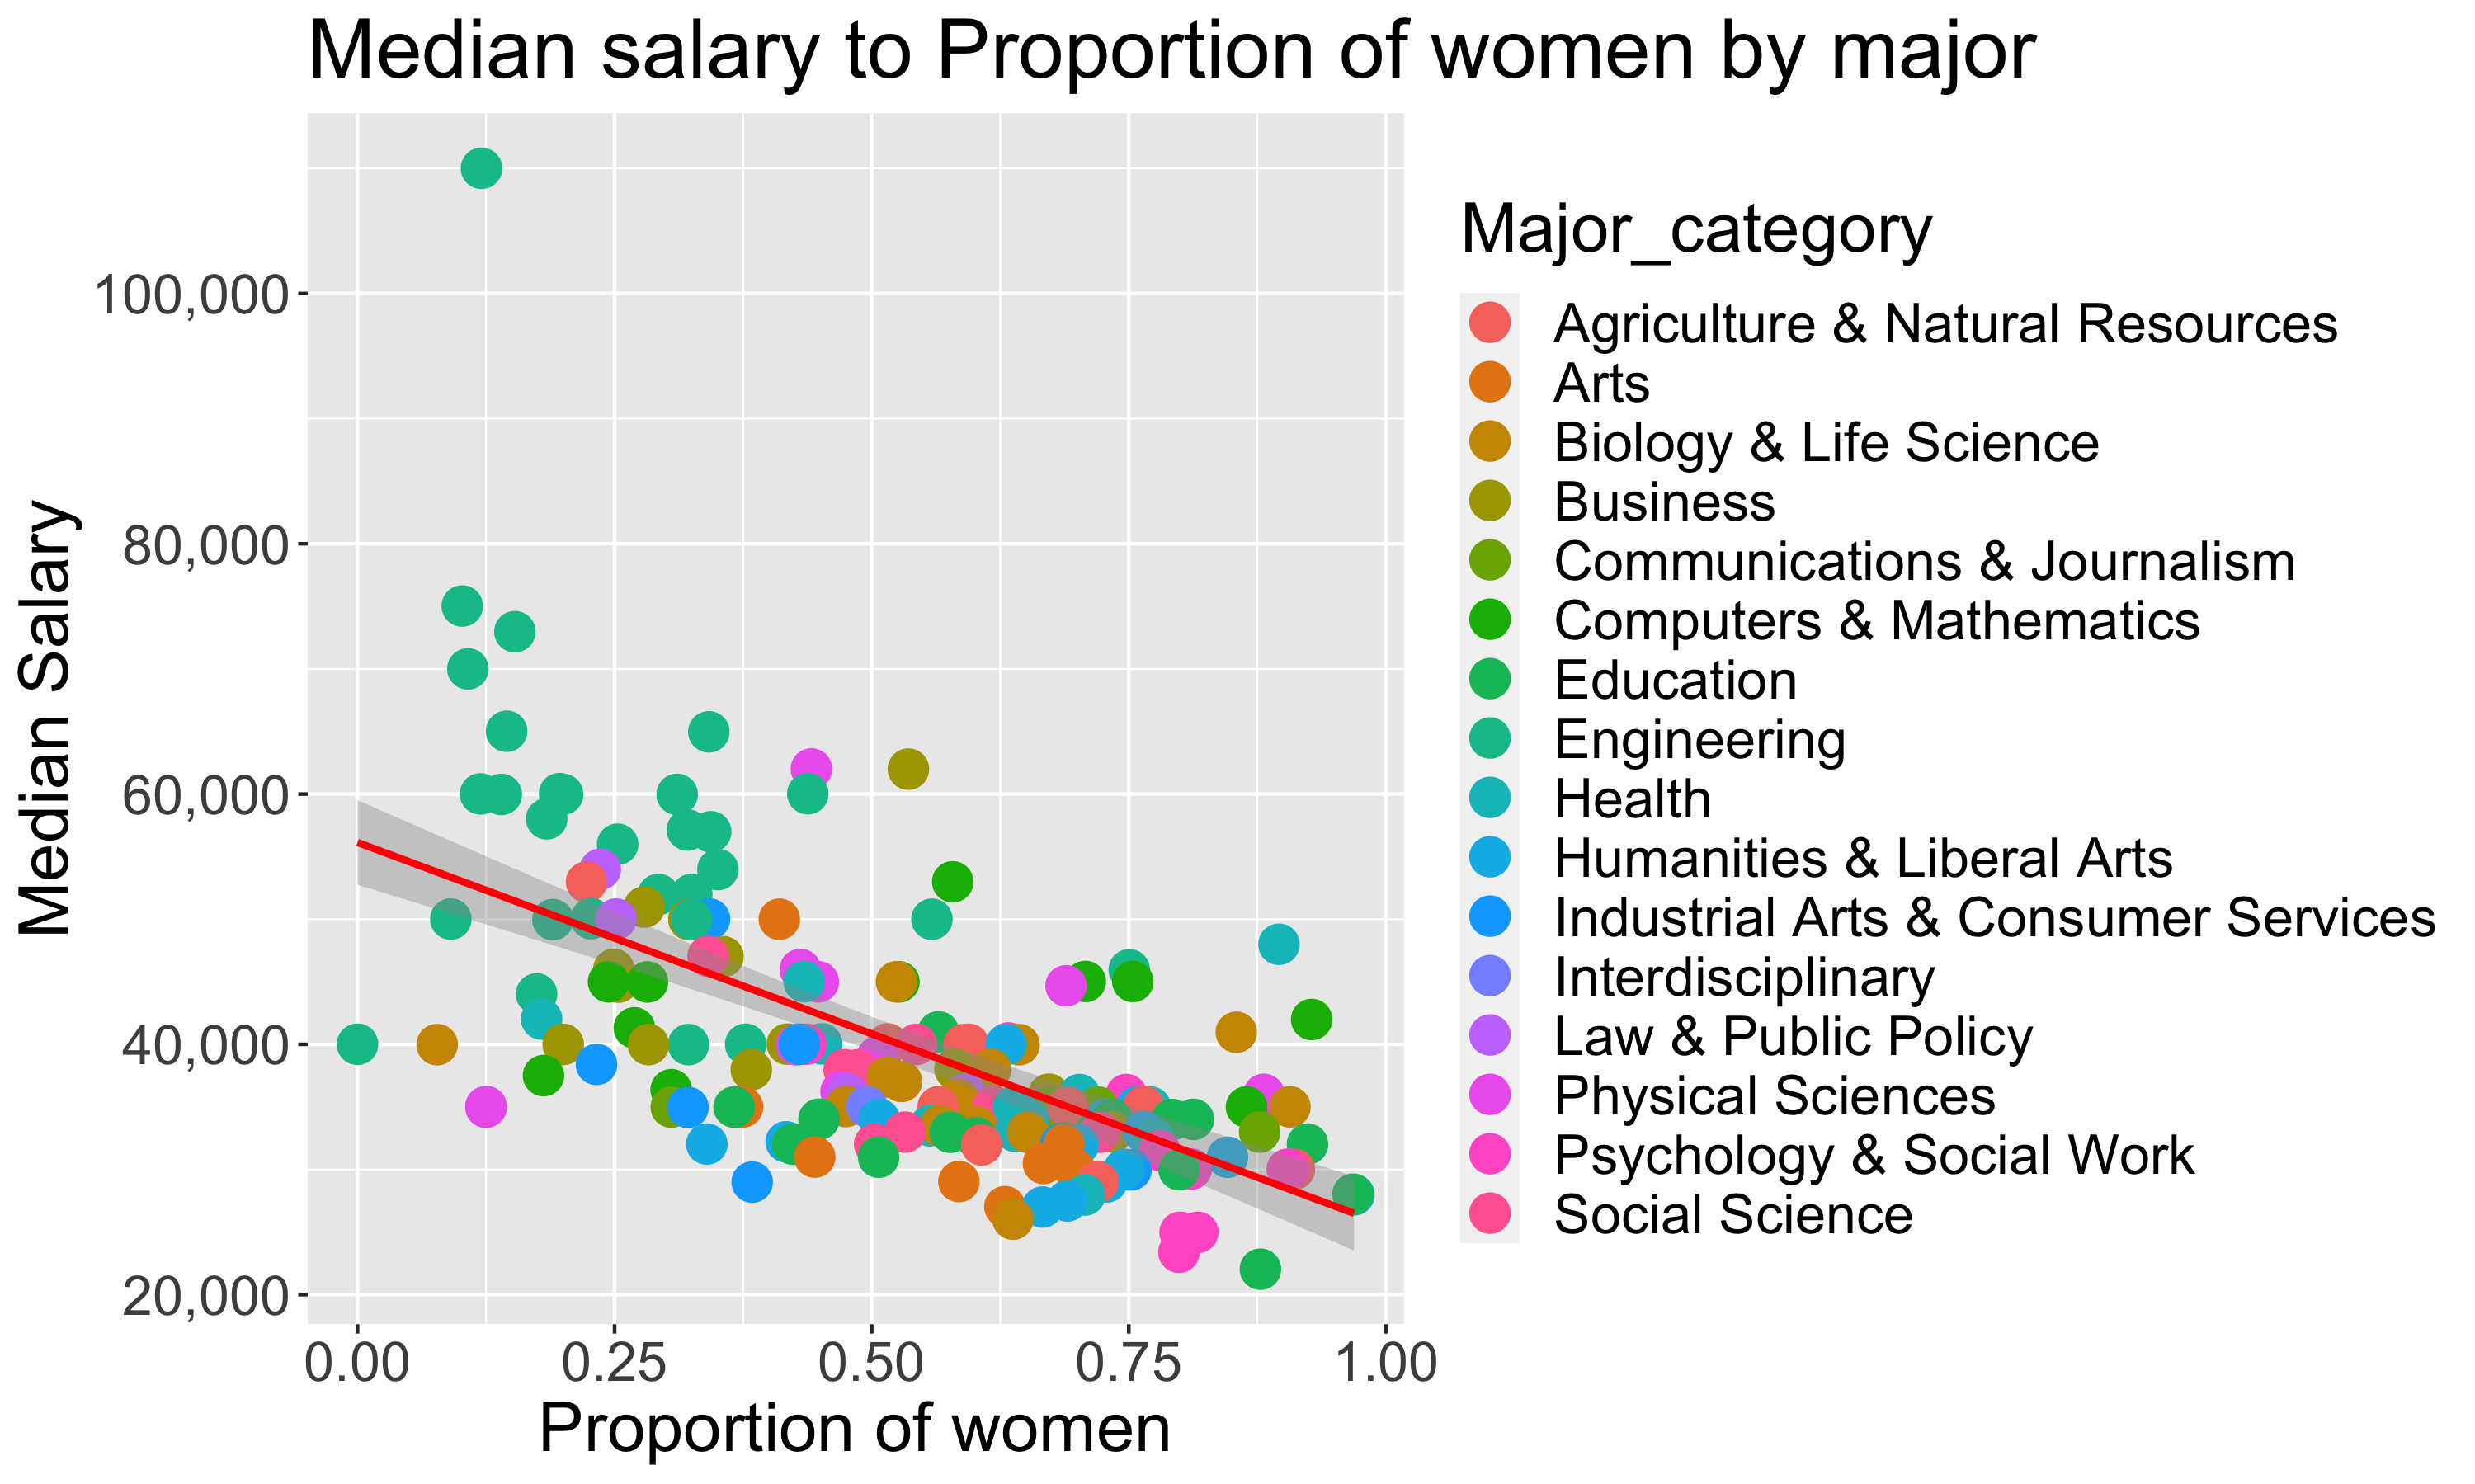
Fitting linear model for the relationship between median salary and proportion of women:
$S{Median} = 56130.94 - 30579.83 * P{Women}$, where S - salary, P - proportion
Coefficient of correlation is -0.6147
This model should follow two conditions to be accepted:
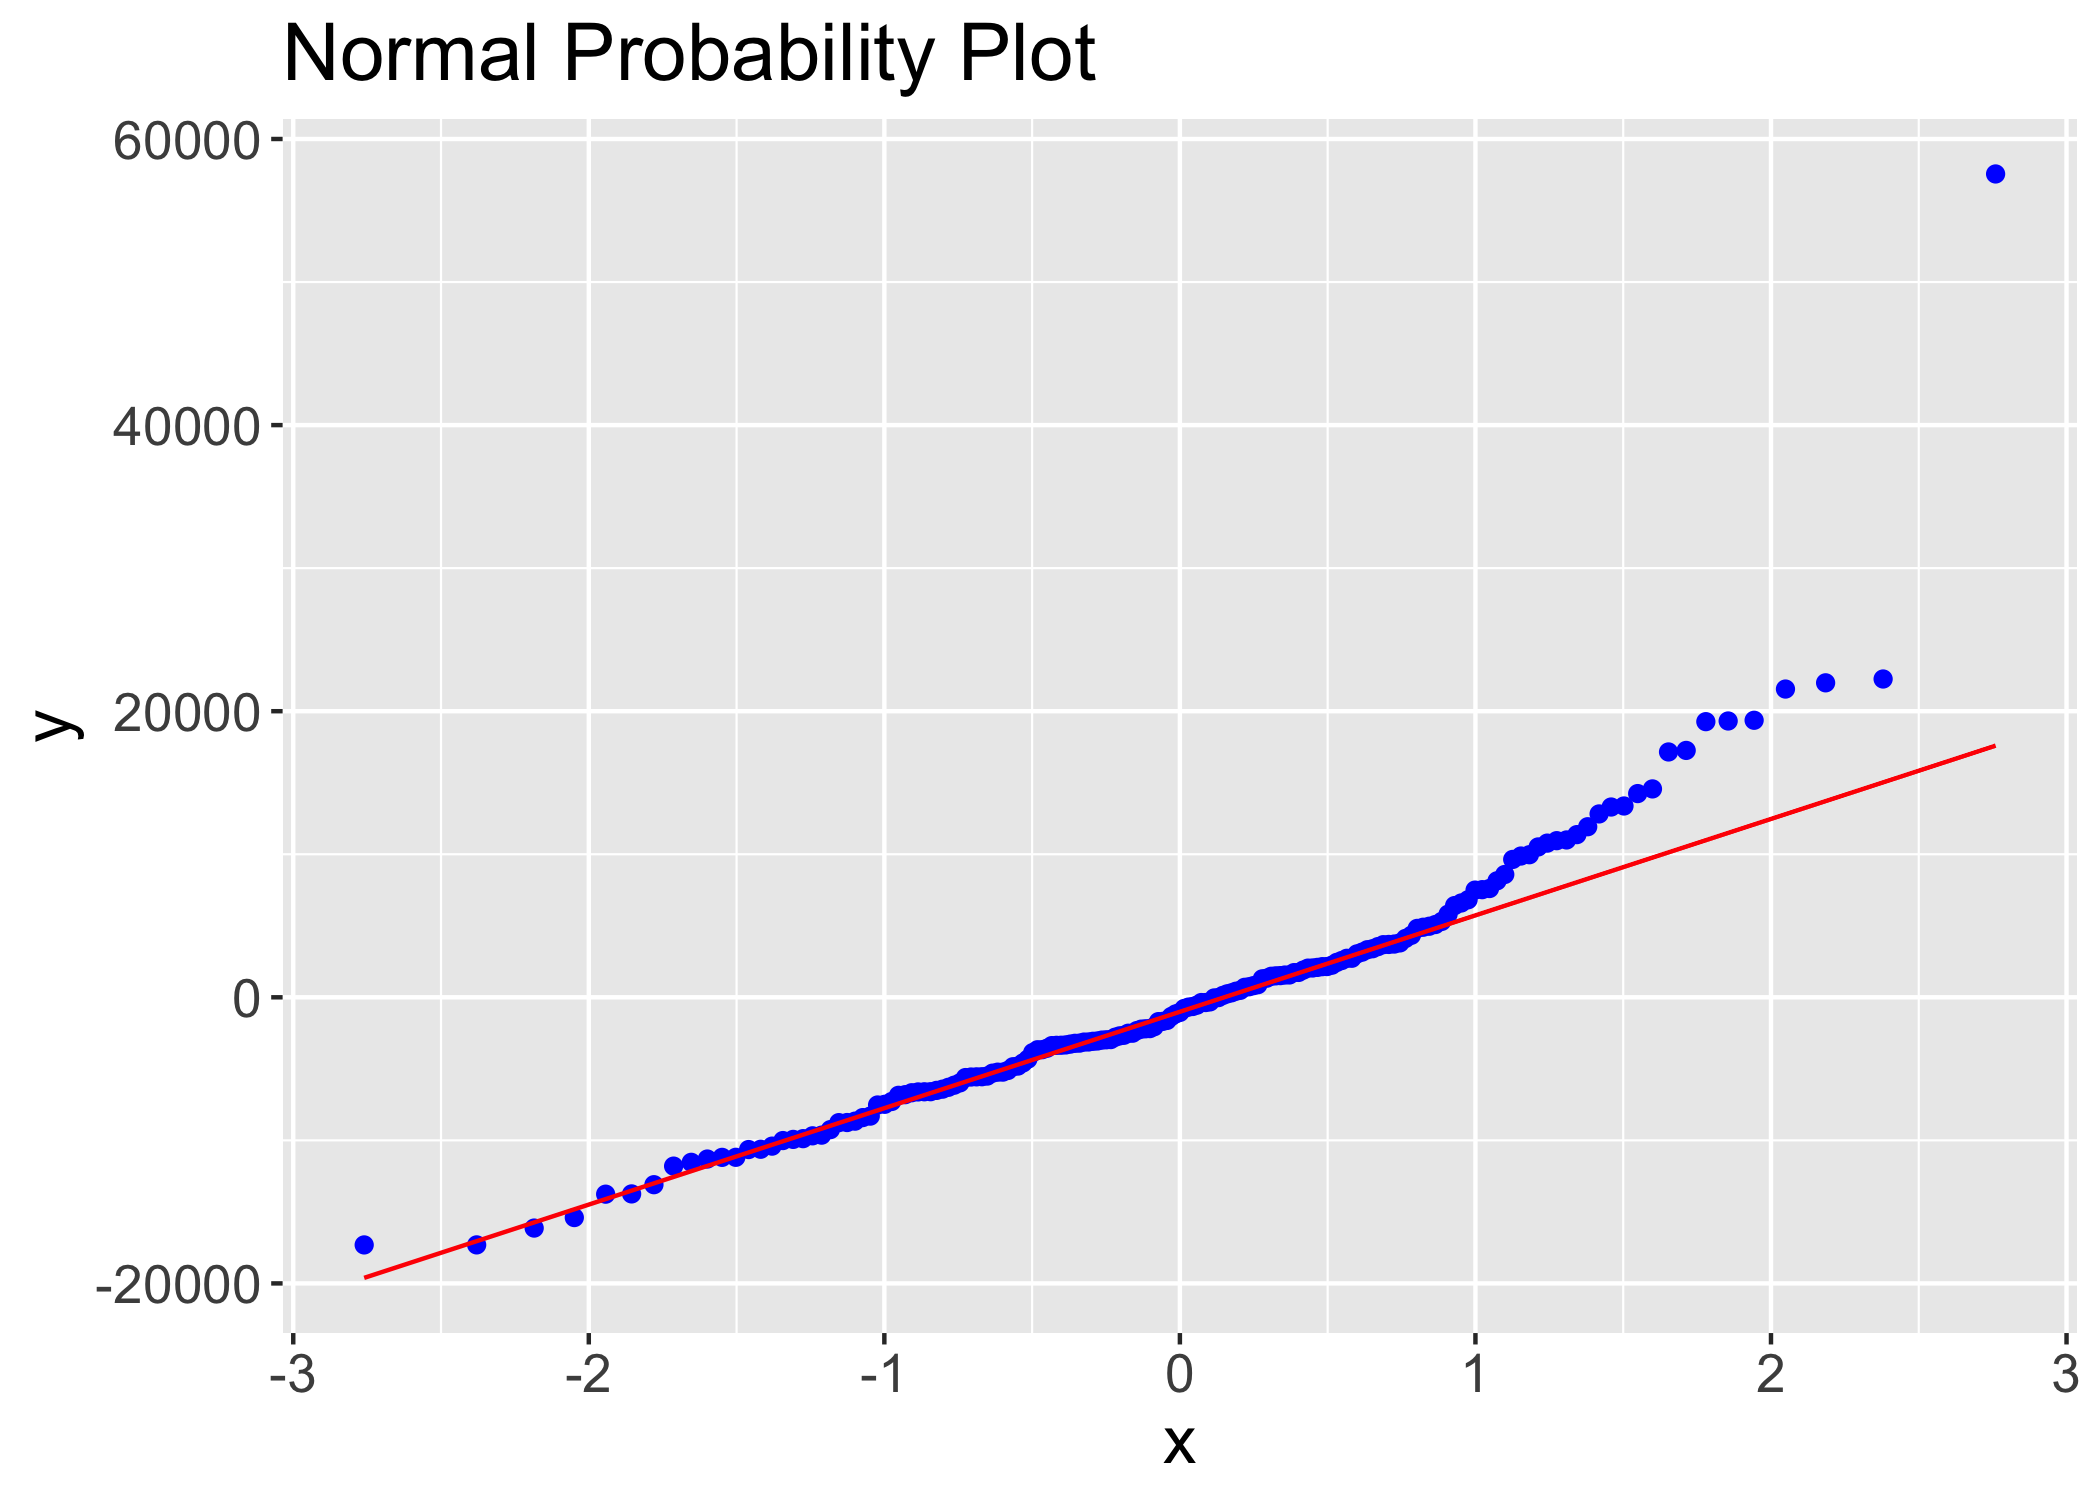
- Normal distribution of variable. For checking this condition we have to calculate residuals between each value and predicted model and use Normal probability plot for residuals to check the normality.
For checking this condition we have to calculate residuals between each value and predicted model and use Normal probability plot for residuals to check the normality.
- Homoscedasticity of distribution - For each distinct value of the x-variable (the predictor variable), the y variable has the same standard deviation $\sigma$
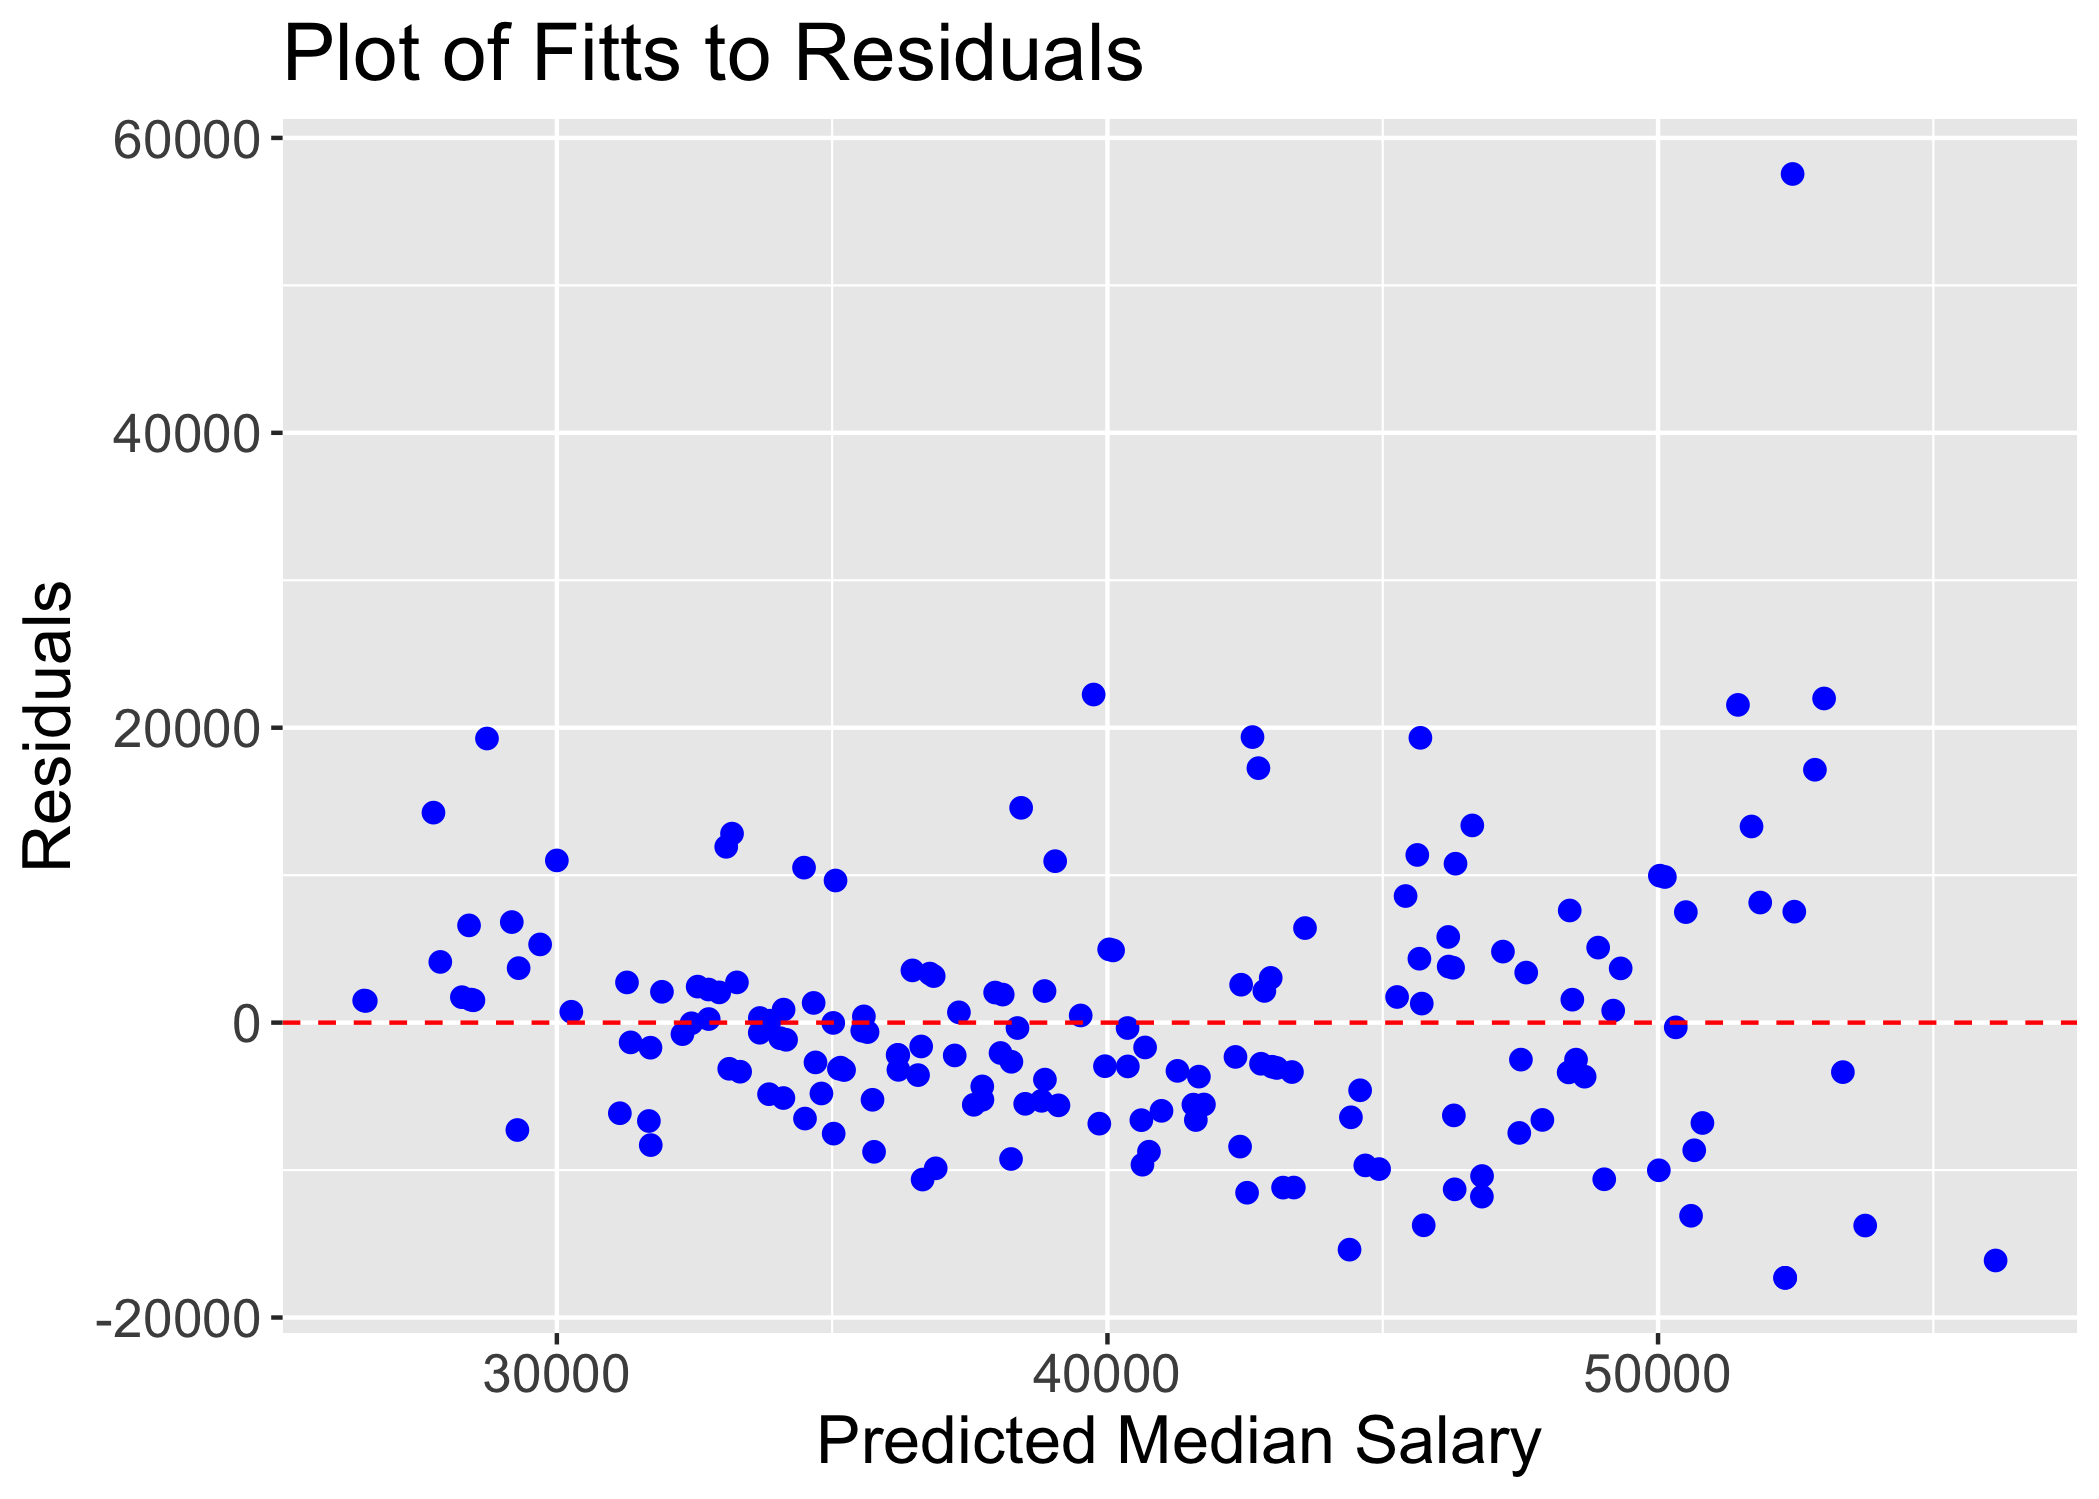
Despite these limitations, based on our current data, we reject our null hypothesis and conclude that the proportion of women across different majors will impact median salary.
Conclusion
Overall, based on our analysis, we can conclude that the major an individual chooses will impact their salary and unemployment rates in the future. Finally, we concluded that as the proportion of women in each major increases, the median salary decreases. This analysis can be helpful for university students choosing their major with more confidence based on their interests and goals. By choosing the right major based on their passion and skills, students would perform better in their university and subsequently in their future jobs and have better mental health. This will help society as a whole and helps it to function better.
Gratitudes
I would like to special thank Dr. Qingrun Zhang and Dr. James McCurdy for the very useful feedback and great insights I received from thier course and my project partners Shrivarshini Balaji and Niloofar Mirzadzare for productive cooperation, responsibility and excellent communication.
References
[2] A. H. A. Rashid, M. Mohamad, S. Masrom and A. Selamat, "Student Career Recommendation System Using Content-Based Filtering Method," 2022 3rd International Conference on Artificial Intelligence and Data Sciences (AiDAS), IPOH, Malaysia, 2022, pp. 60-65, doi: 10.1109/AiDAS56890.2022.9918766.
[3] H. Ali, "How to Choose the Right Career Path [The Way Ahead]," in IEEE Potentials, vol. 40, no. 6, pp. 3-4, Nov.-Dec. 2021, doi: 10.1109/MPOT.2021.3109250. “Determinants of College Major Choice: Identification Using an Information Experiment,” Review of Economic Studies 82(2), 2015, pp. 791–824. See also “How Do College Students Respond to Public Information about Earnings?” Wiswall M, Zafar B. Journal of Human Capital 9(2), 2015, pp. 117–169.
[4] “Human Capital Investments and Expectations about Career and Family,” Wiswall M, Zafar B. Journal of Political Economy 129(5), 2021, pp. 1361–1424.
[5] “Preferences and Biases in Educational Choices and Labor Market Expectations: Shrinking the Black Box of Gender,” Reuben E, Wiswall M, Zafar B. Economic Journal 127(604), 2017, pp. 2153–2186.