Depression Worldwide
← Back
GitHub Repository
Authors:
Introduction
Mental health, which affects behavior and coping abilities, is crucial, and depression is a prevalent mental illness worldwide [1]. Depression's symptoms include persistent sadness, loss of interest, and other complex causes like genetics, lifestyle choices, and major life events, and it can result in functional disabilities and suicidal behavior. Due to modern society's chronic stress, substance abuse, and unhealthy lifestyles, depression rates are on the rise, necessitating an examination of diagnostic and treatment options [2].
First of all we will compare the prevalence of depression Worldwide and how can be calculated the burden of depression on society and economics. We also discuss how can different countries work with the depression rate and how the decrease the burden of this mental disorder.
Methodology
For this project, we aim to use SQL to extract data and create visualizations in python. We will first connect our datasets to SQL. Subsequently, we will write SQL queries (requests) to extract data needed for visualizations and perform any necessary data cleaning/wrangling (i.e. removing missing values, merging tables, etc.). Finally, we fetch our data from the SQL databases into pandas data frames and create relevant visualizations using plotly.
Datasets
People all around the world experience mental health issues, and different countries address these problems in different ways for various reasons. In the first question, we examine the distribution of people with depression worldwide, based on 3 datasets.
The "Global Trends in Mental Health Disorder" dataset is sourced from Kaggle [3] and is available for use with citations of the dataset author [4]. It contains informative data from countries worldwide, covering the prevalence of mental health disorders such as schizophrenia, bipolar disorder, eating disorders, anxiety disorders, drug use disorders, depression, and alcohol use disorders from 1990 to 2017. We utilize data from the final year of the dataset to determine the percentage of people suffering from depression in each country.
To measure the impact of depression within each society, the parameter of disability-adjusted life year (DALY) per 100,000 people is utilized. The DALY parameter is employed to gauge the total burden of depression. To compare countries using this parameter, the dataset "DALY” estimates WHO Member States by country. This dataset is sourced from the official World Health Organization website (http://who.int) and may be utilized for research purposes, with proper citation [5]. The dataset includes DALY parameters for each country in the WHO for every monitored disorder, segregated by gender and age, spanning the years from 2000 to 2019. For our project, we will be utilizing the data for depression disorder from this dataset to compare countries based on the DALY parameter.
The dataset about expenditures for the healthcare system worldwide is taken from The World Bank website [6]. This dataset contains health expenditures in percentage to GDP, expenditures in U.S. dollars, and expenditures in U.S. dollars per capita for 2019 by countries. This data is used in combination with the dataset "Government expenditures on mental health as a percentage of total government expenditures on health (%)" from the World Health Organization website [7]. By combining these data, we can analyze spending on mental health worldwide by country and the efficiency of money spent on diagnostics and treatment in each healthcare system.
Jupyter Notebook
The project jupyter notebook with Python Code and SQL queries is provided in file: https://github.com/orlovtsu/depression_worldwide/blob/main/depression_worldwide.ipynb
The database credentials are not provided because of safety, but anyone who want to reuse this code can use it with own database. I used MySQL database on AWS instance.
Results
1. Countries by proportion (%) of people with depression
To compare different countries by proportion of people with depression we are going to create a World Map with countries filled by color of different intensity. For the whole project we take the data on 2017 year. To make this Map we need to get dataframe with name of countries and the depression proportion in each country in 2017.
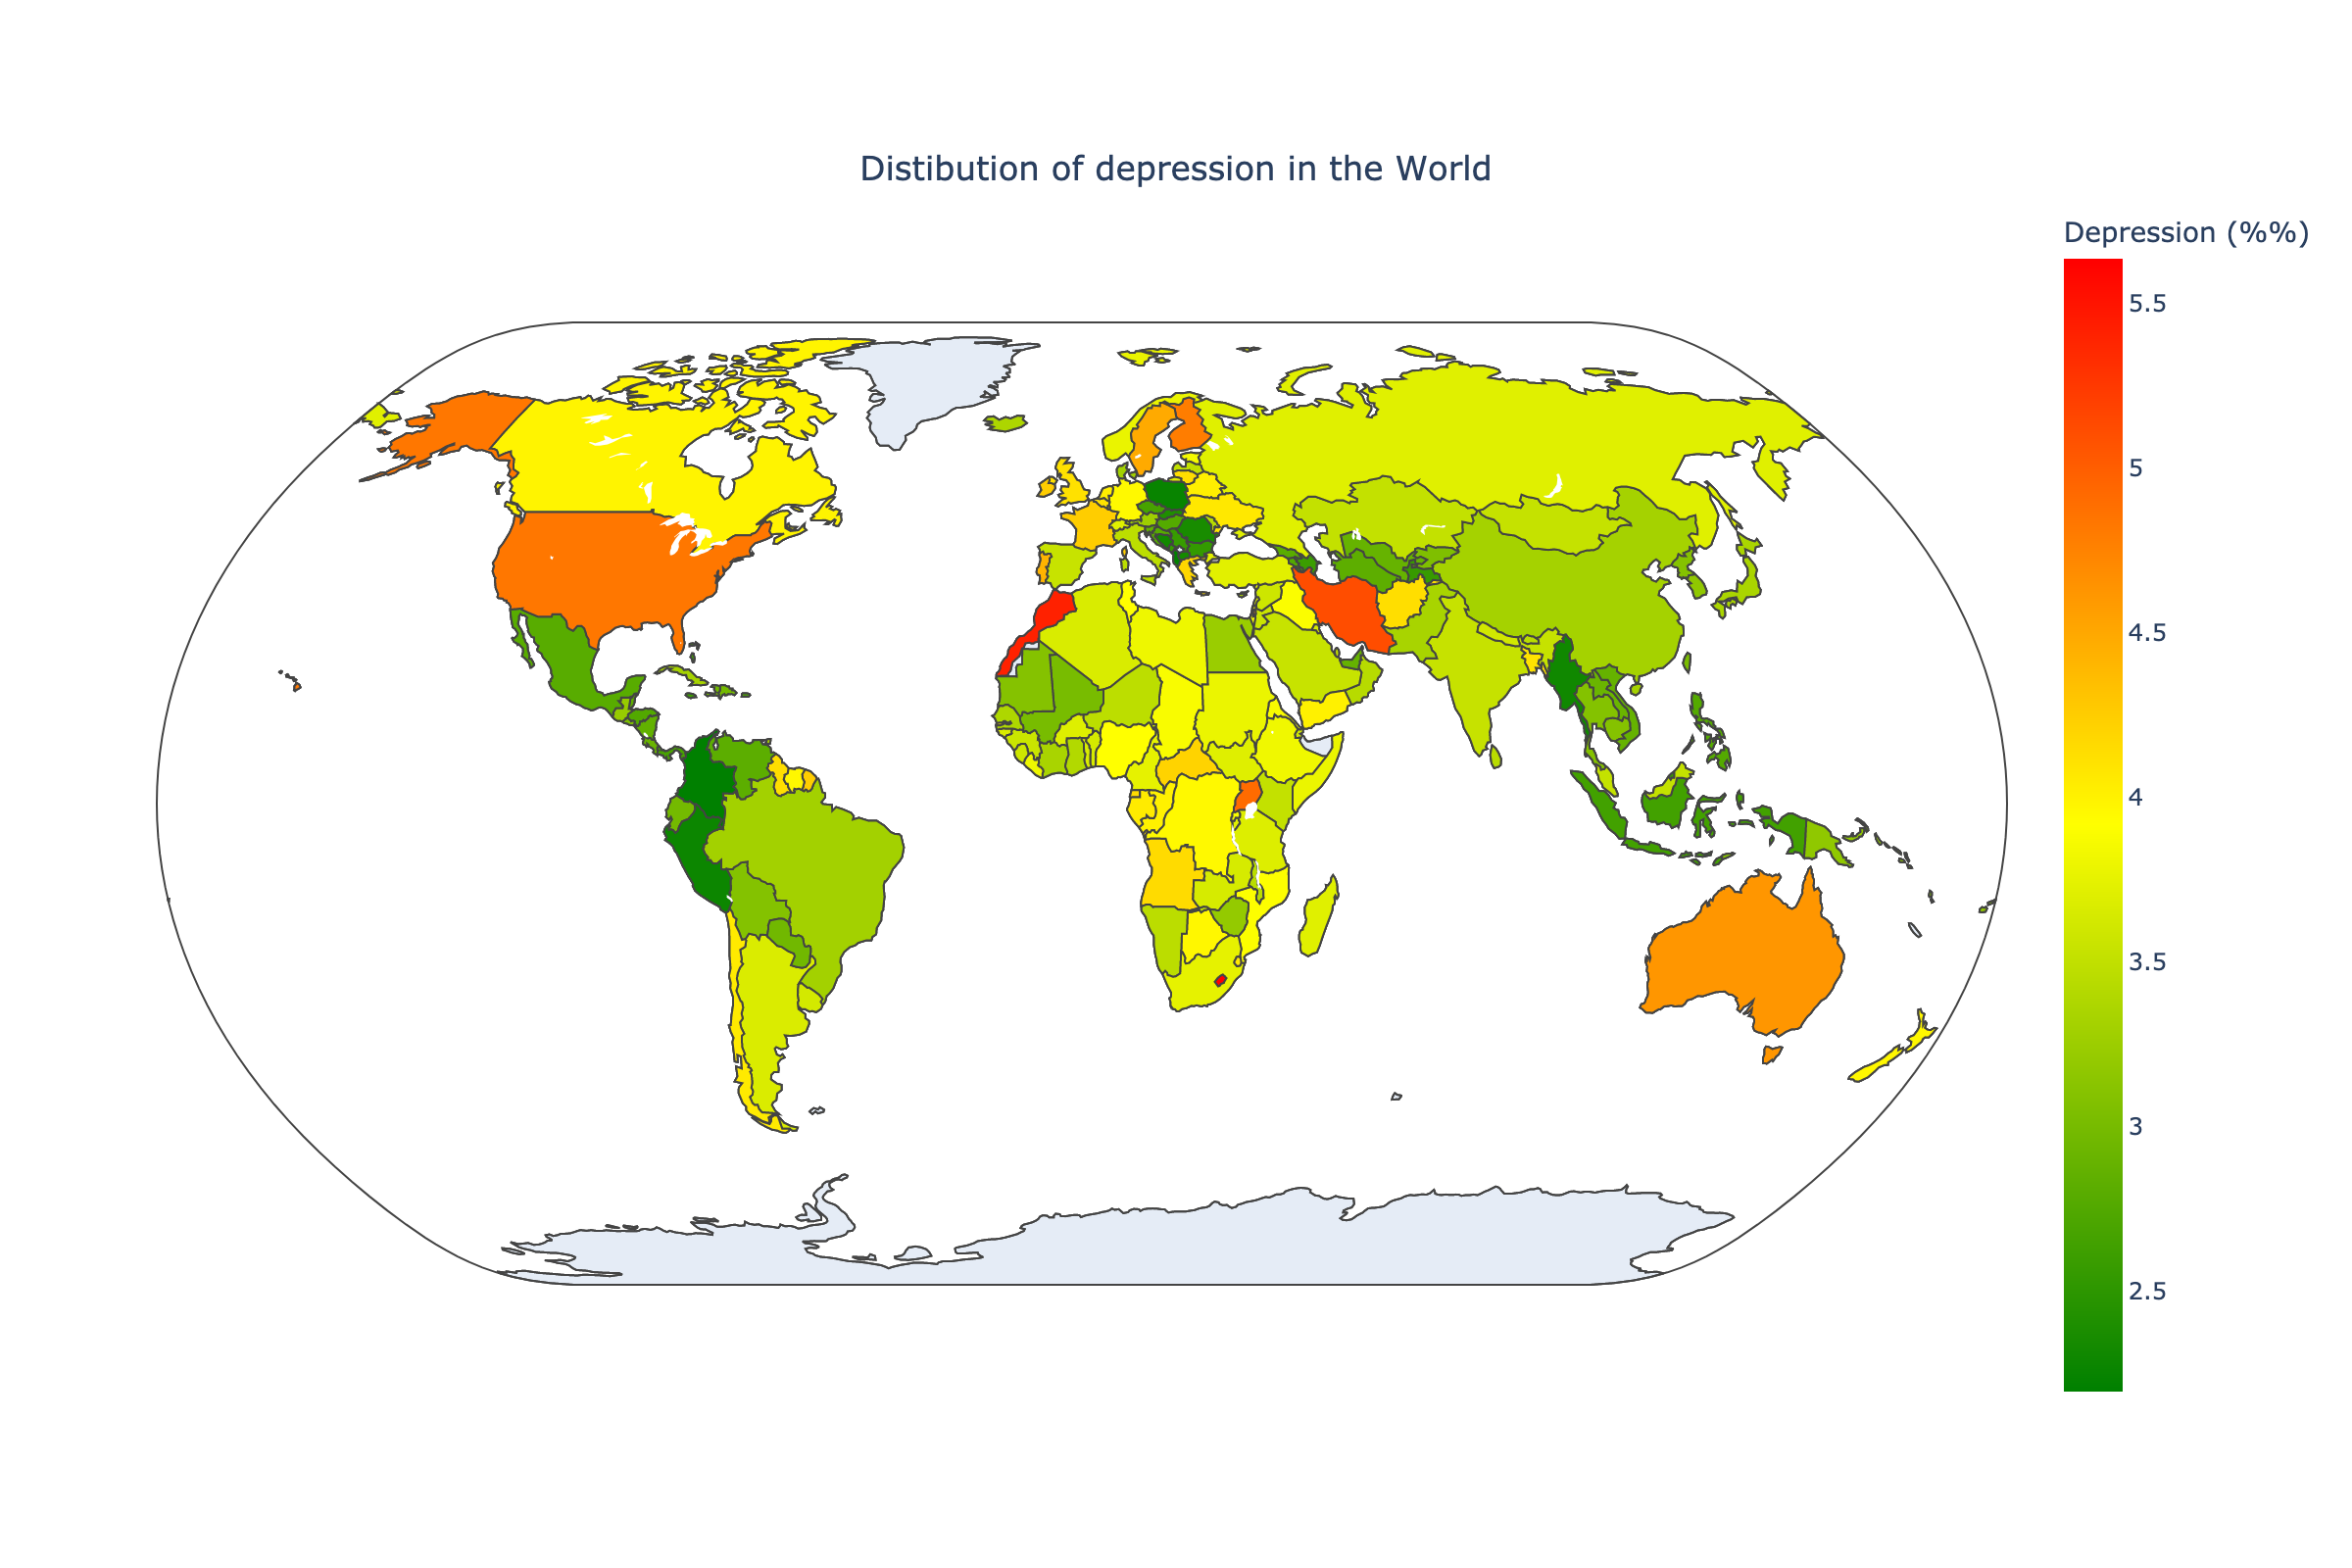
As we can see from the picture of distribution of diagnosed depression worldwide, the depression rate is highest in most developed countries such as U.S, Canada, Europe, Australia etc. But this is the rate which shows the rate of diagnosed depression. There is the probability of higher hidden depression rate in other countries. But the more important parameter to consider is the value of burden of economics and society. This parameter is called DALY (disability-adjusted life years).
2. DALY caused by the depression by country
To measure the impact of depression within each society, the parameter of disability-adjusted life year (DALY) per 100,000 people is utilized. So, to understand the total burden of depression on each society we want to consider the distribution of DALY worldwide. The distribution will be in different plots such as World Map with countries filled by color depending on the DALY parameter and scatterplot DALY-Depression proportion.
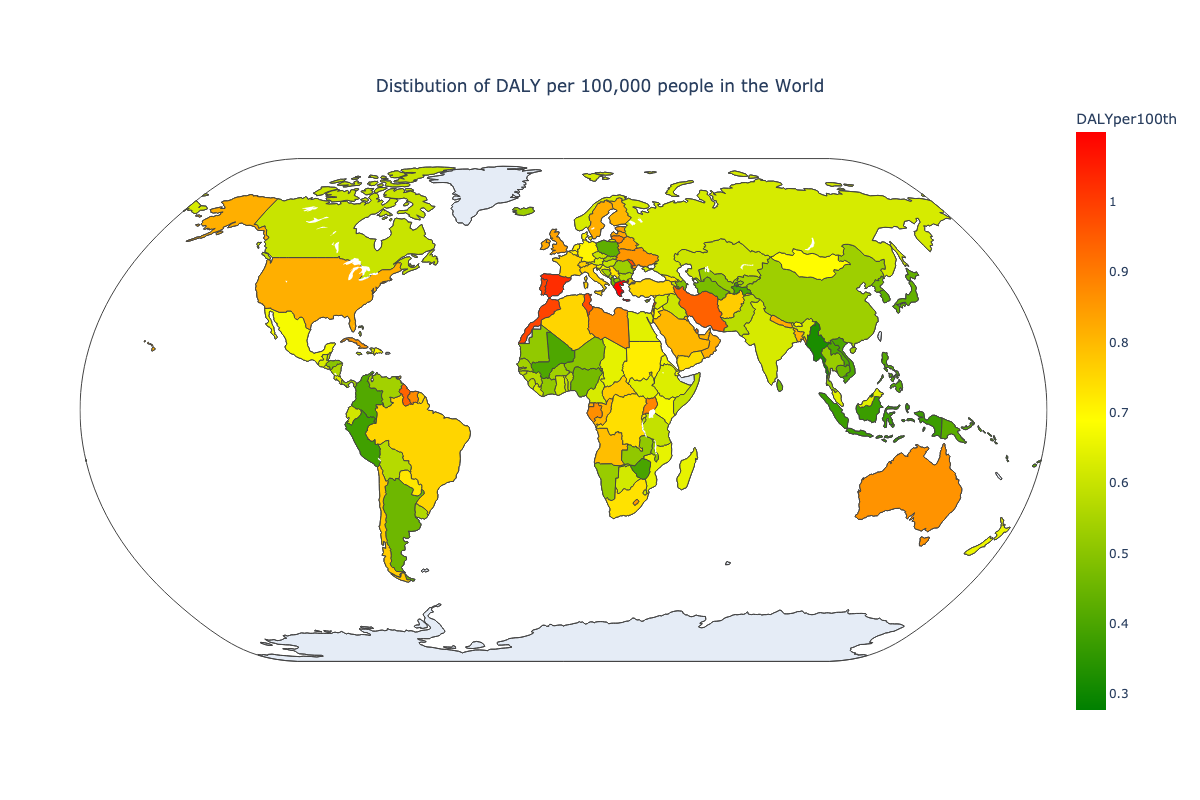
The distribution of DALY worldwide shows that countries which have higher burden of depression on thier society and economics are different than countries with higher diagnosed depression. It means that our hypothesis about hidden depression influence can be significant. Let's consider the correlation between Depression and DALY rates.
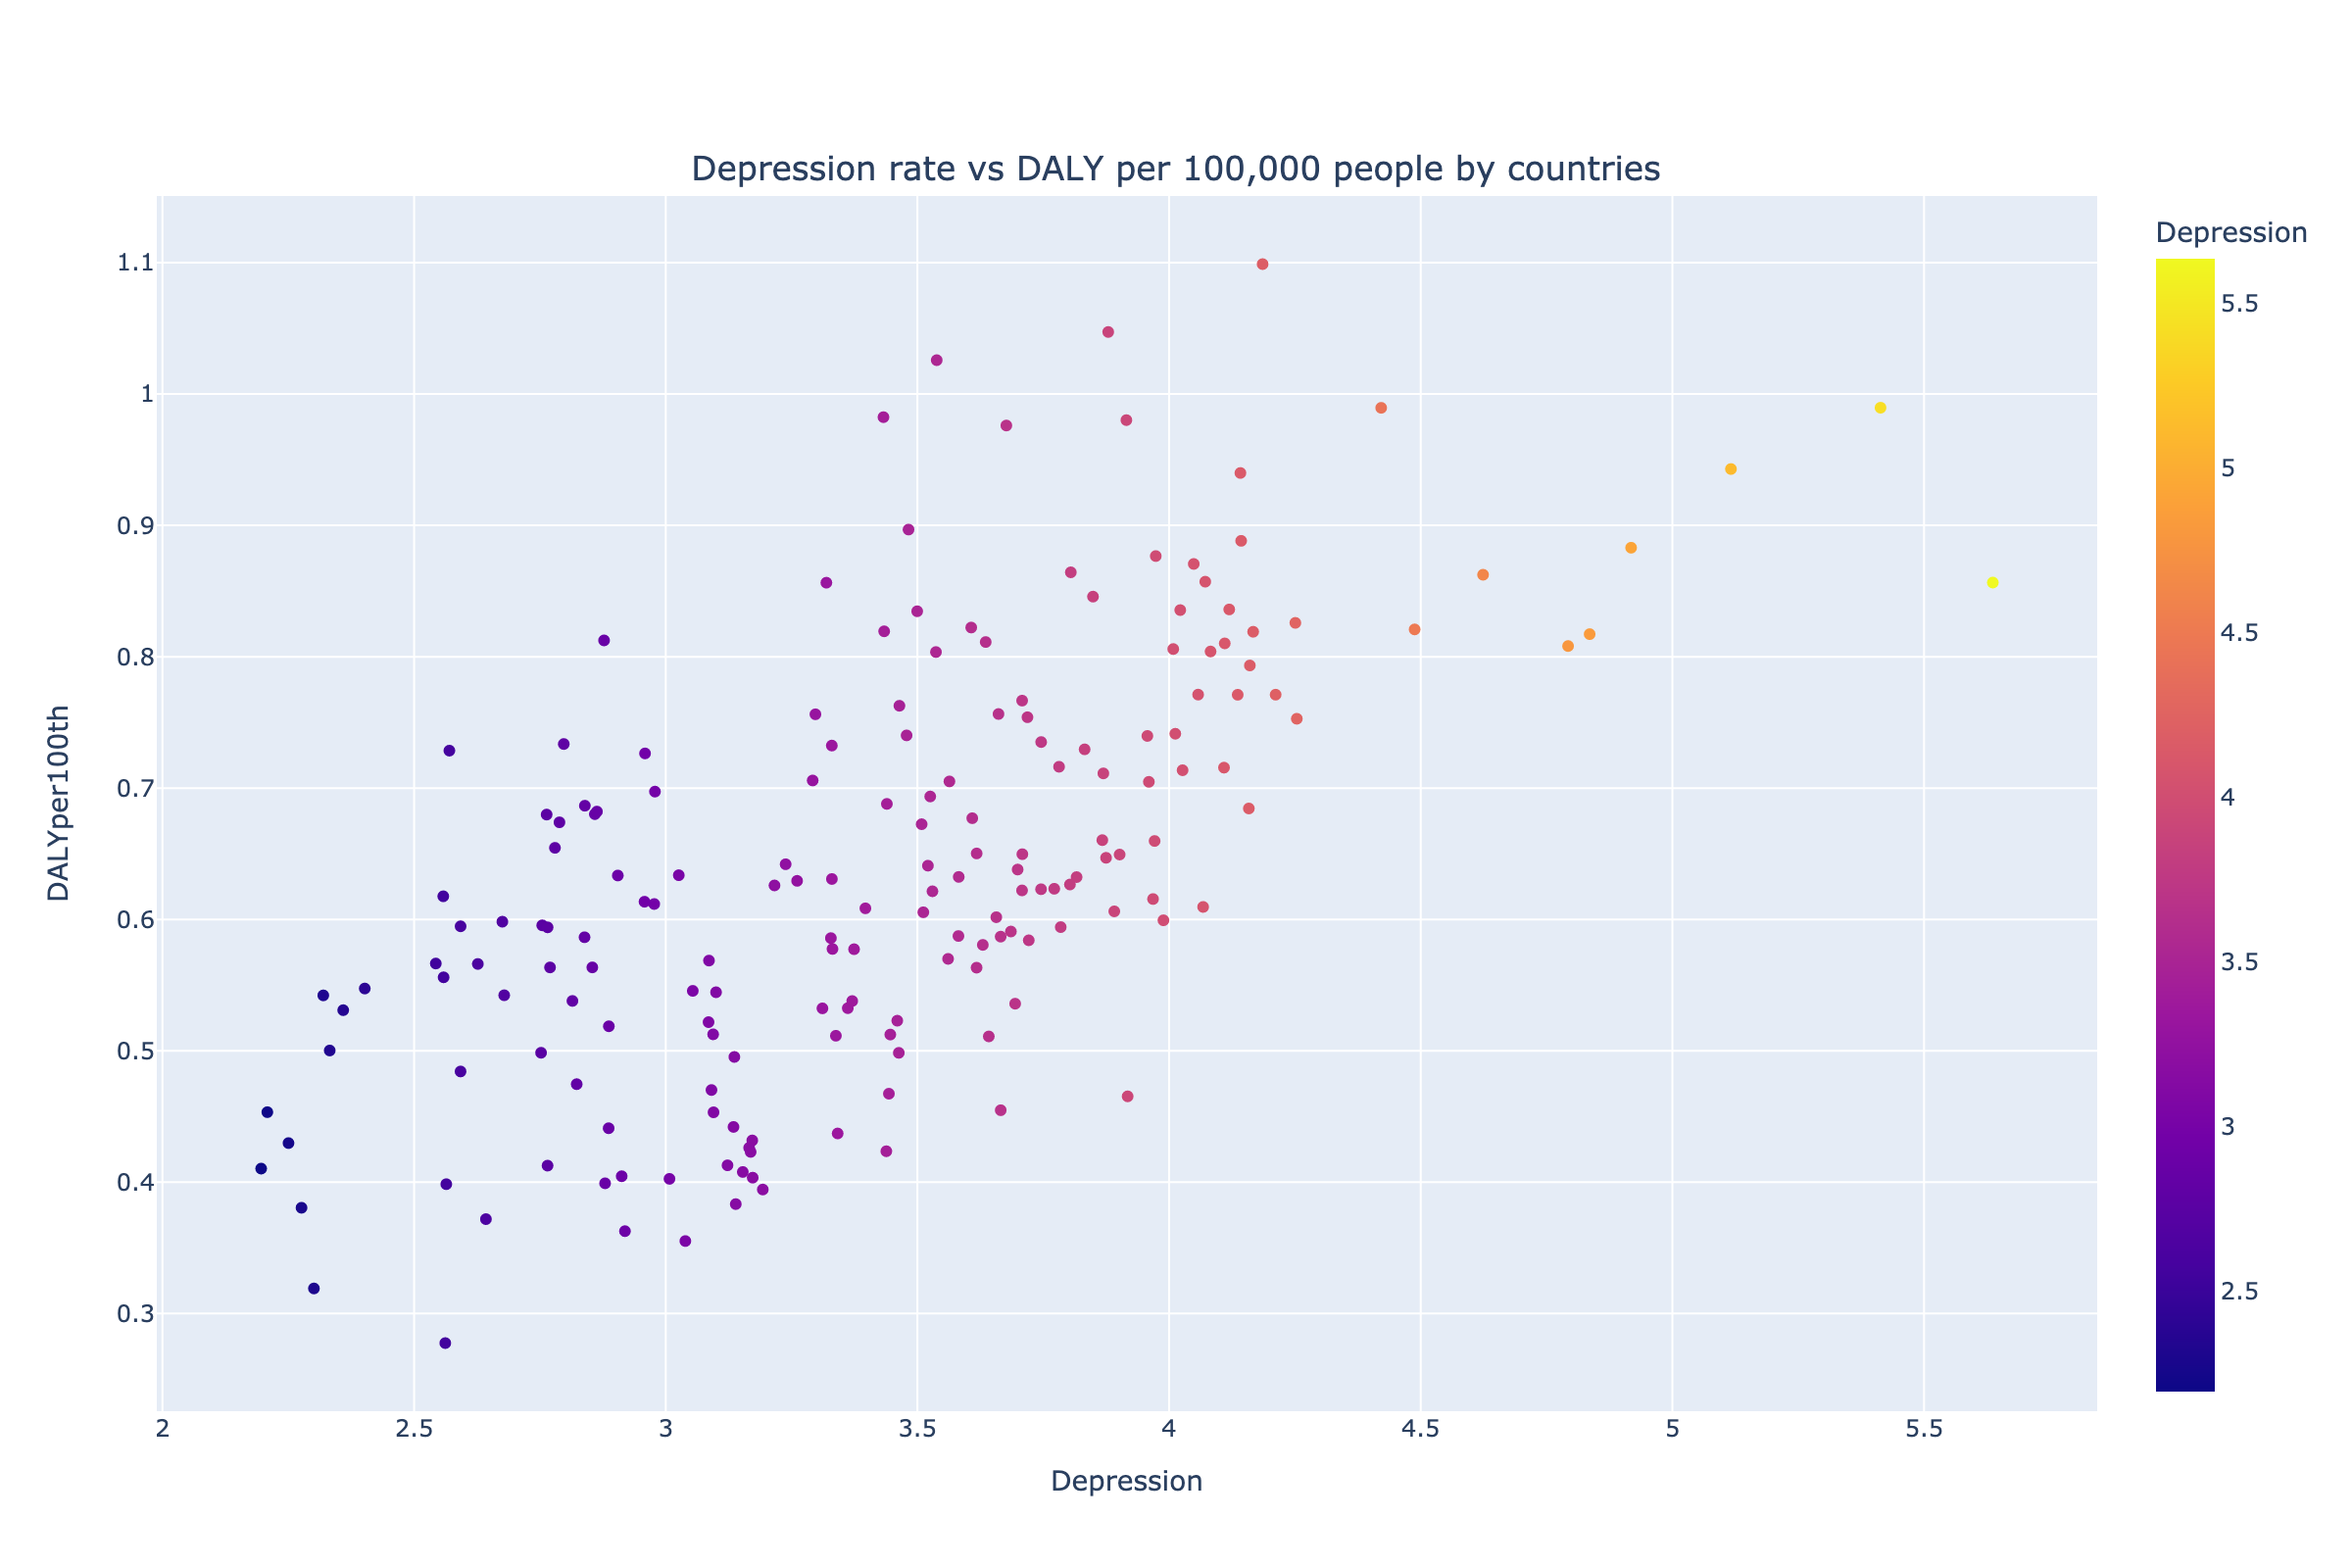
As we can see from the scatterplot of DALY per 100,000 people and Depression rate, there is a corelation between these rates. As depression rate increases the rate of DALY increases too, but this increasement is different depending on different countries. It may be interesting what parameters influence on the DALY comparing different countries. To compare we use the parameters of different Health Systems and expenditures on Health Systems.
3. Depression depending on HealthCare system expenditures and affordability of mental health help by country
To find any dependence of the depression disorder on health care system parameters we decided to check if there are any significant dependencies between the depression proportion by country and such parameters as affordability of menthal health beds in general clinics, beds in mental health clinics, numbers of psychoterapists, number of phycologist, number of social workers and diffrerent economic factors.
The dependencies will be checked by different scatter plots.
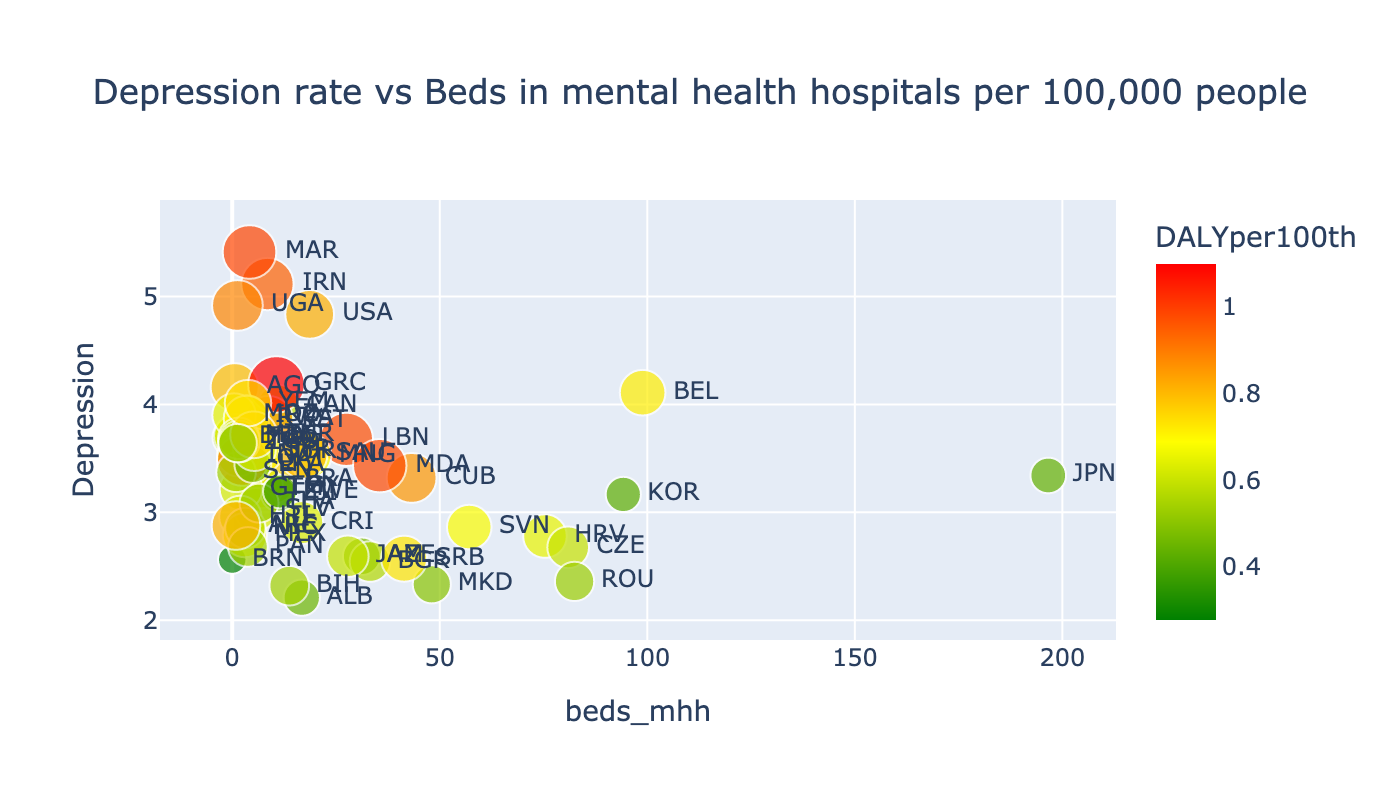
The circle sizes and color of points on the scatterplot of Depression rate on the number of beds in mental health hospitals are the rate of DALY. As we can see from the plot there is dependence of Depression rate on the number of beds. As the number of beds in mental health hospitals increases the rate of depression faults. And we can see that most countries in the left part of the plot are most developed countries which pays a lot of attention to health system and mental health diagnostics.
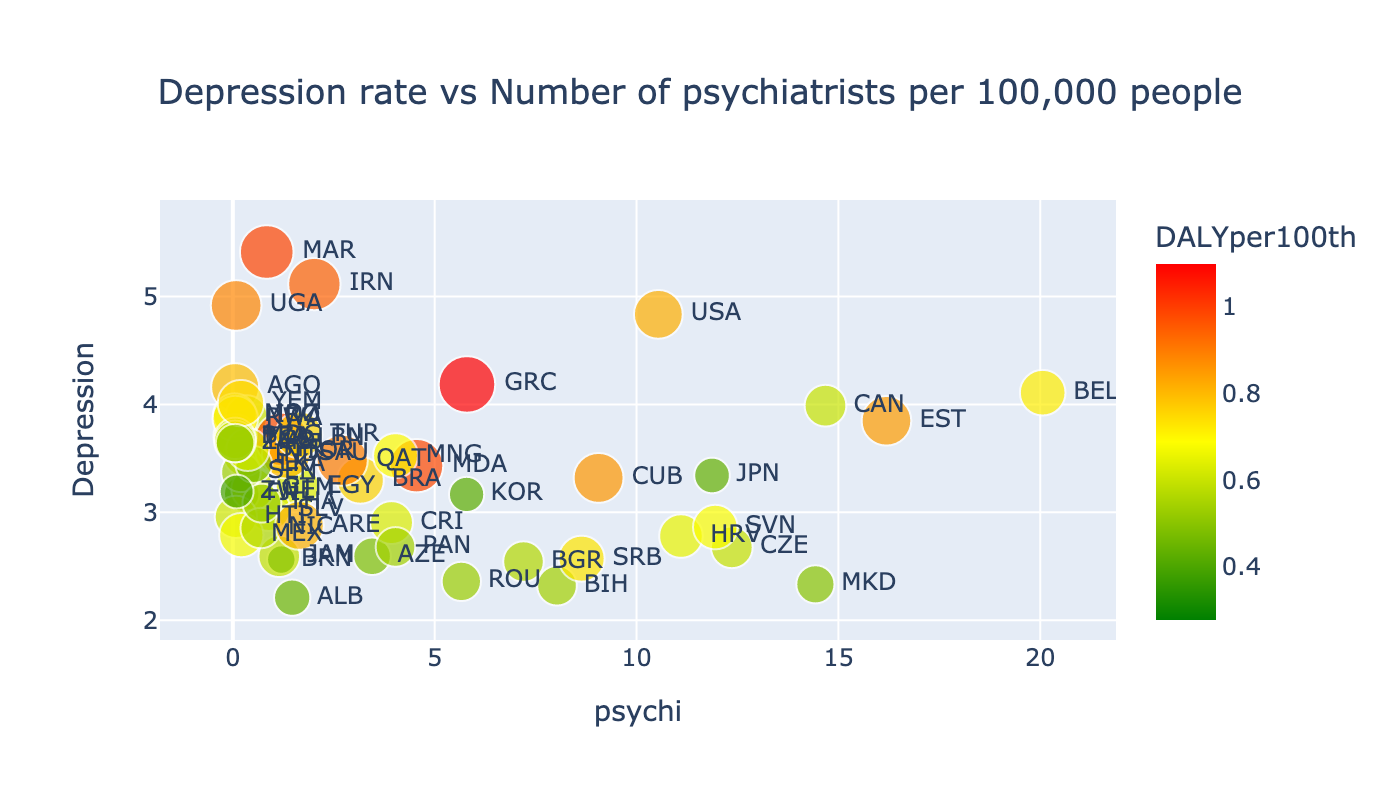
From the scatterplot of Depression rate on the Number of psychiatrists per 100,000 people we can see the similar result. As the number of psychiatrists increase the depression rate faults. If countries invest their efforts to create more job positions for psychiatrists, the average rate of depression faults. Let's consider the same dependencies for DALY parameter.
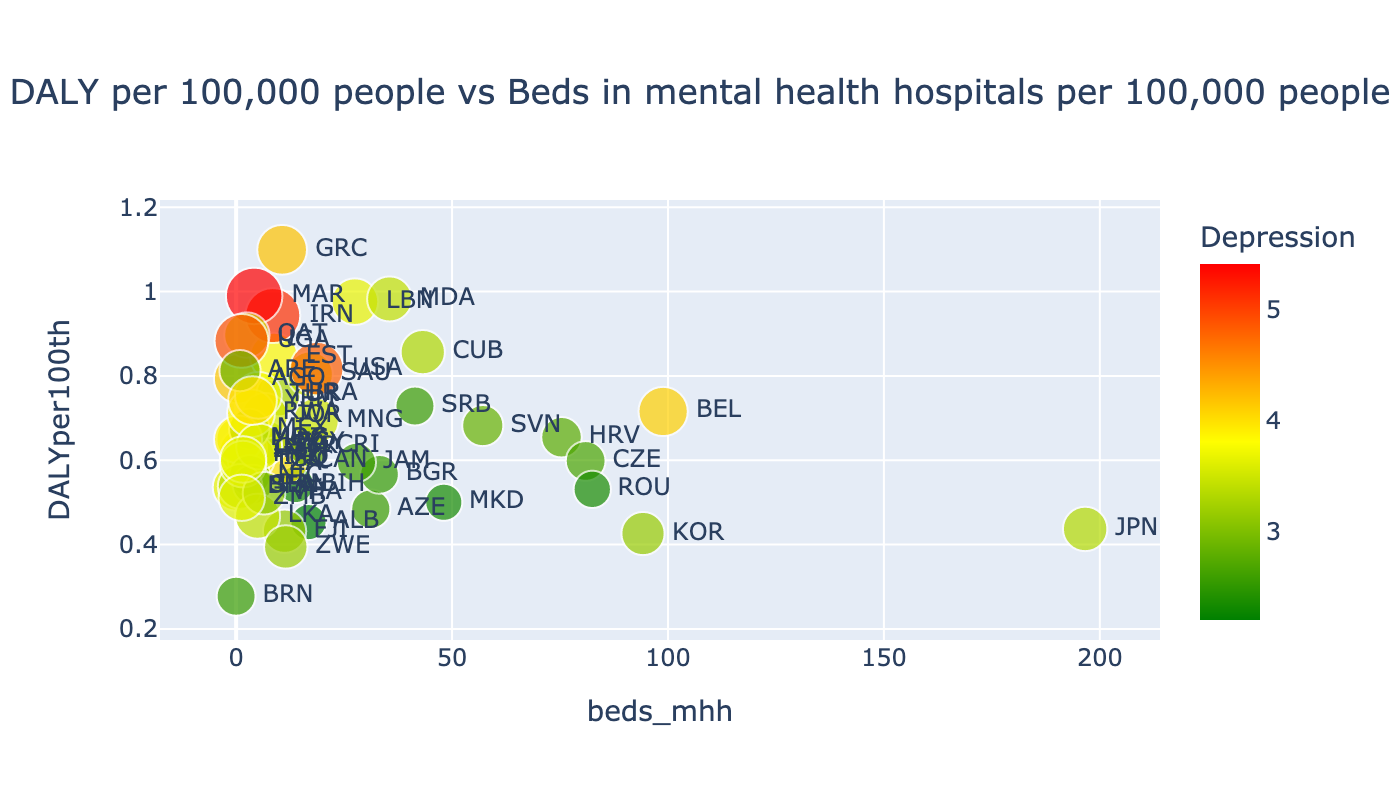
As we can see from this scatter plot, the correlation of DALY is the same as the Depression rate. As the number of beds in mental health hospitals increase the rate of DALY decreases.
From the DALY per 100,000 people and number of psyciatrists per 100,000 people scatter plot we can see the same pictrure. So, we can conclude that these two parameters: beds in mental health and number of psychiatrists are very significant for the depression rates and DALY.
4. Distribution of DALY and % depressed people of expenditures by country
To understand the dependence on economic factors we will use the same methods as scatterplots, bargraphs, boxplots and linear regression. Different economic factors we use are health ependitures by country in percentage on GDP, the proportion of goverment and personal expenditures on health, health expenditures per capita. For this task we use data of 2016 because it is the year of expenditures which is previous to 2017 when we check the depression disorder. So, we the average effect of efforts and expenditures in 2016 can be checked in 2017.
To understand how effective different countries diagnose and treat the depression we want to check the dependencies between DALY and % of depressed people on health expenditures per capita. All data we need to create such scaterplots and other graphs we already have, but some of these data has null values which we want to delete from our dataframe.
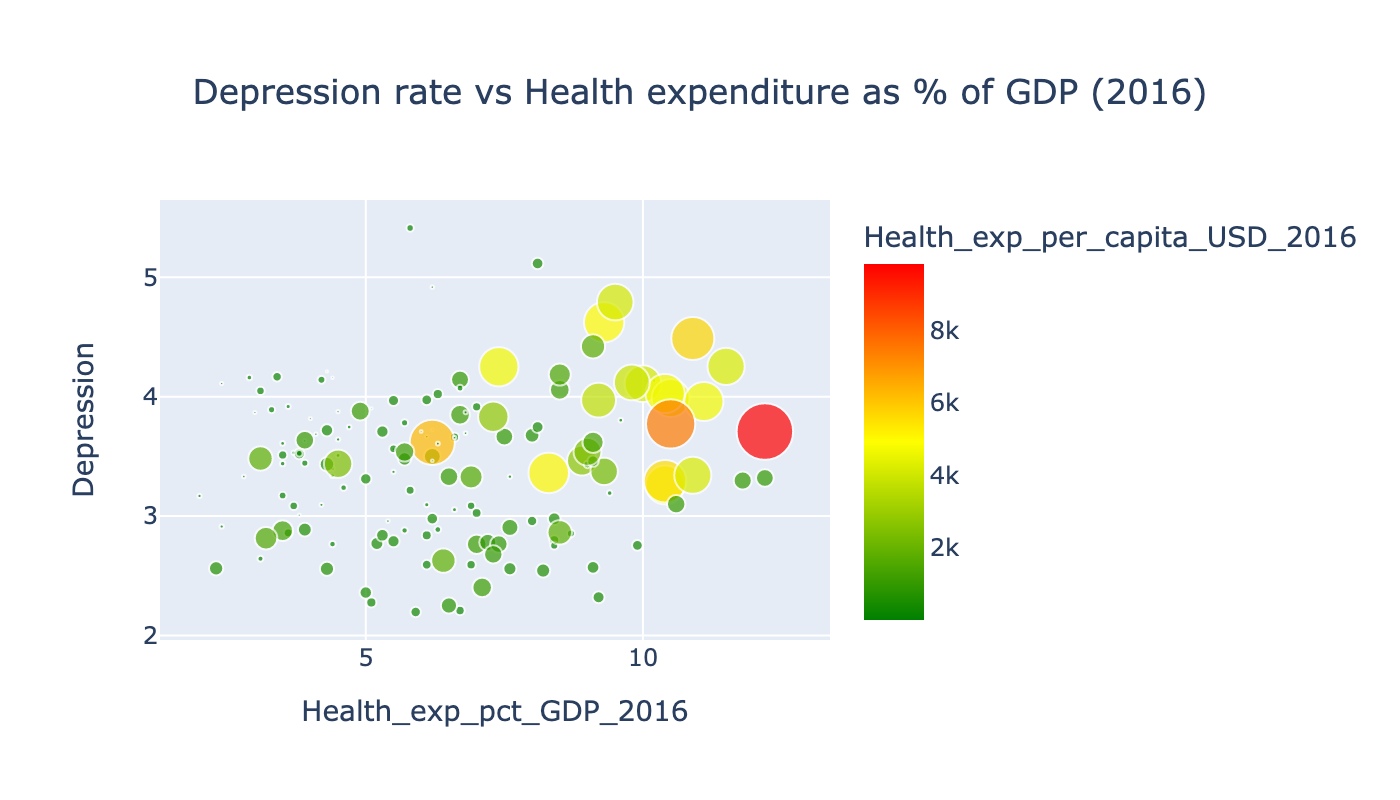
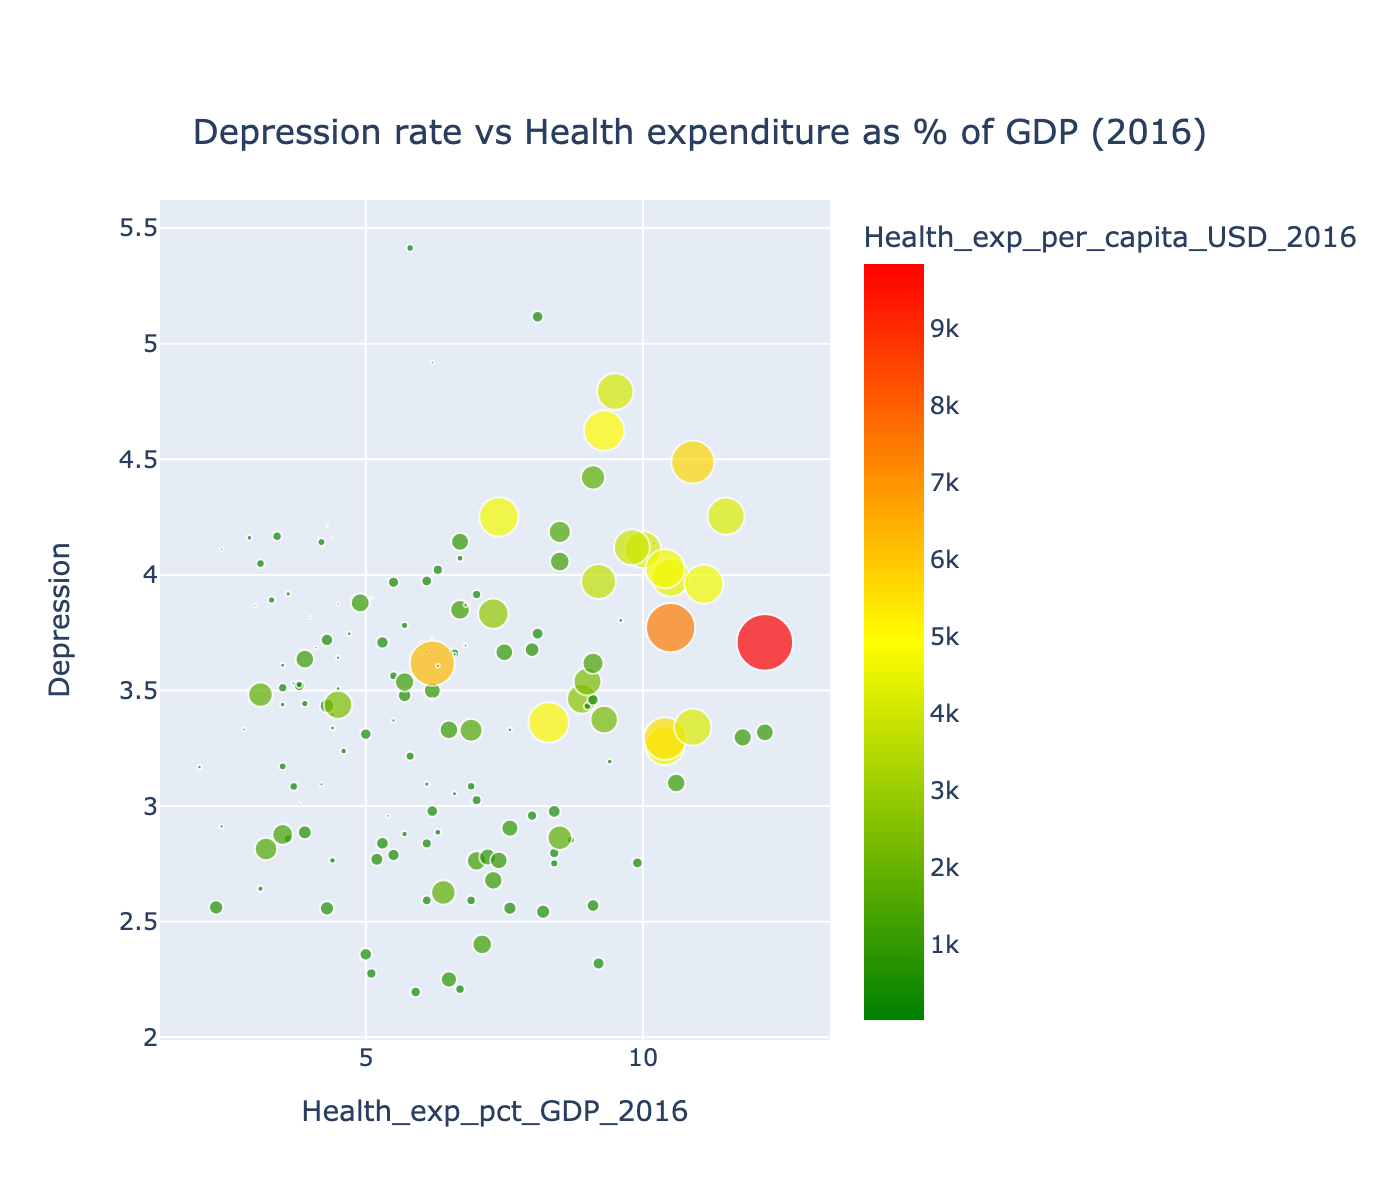
From the scatterplot of Depression rate on Health expenditures as % of GDP we can see that most developed countries spent more money for health, which helps to diagnose more depressed people. If countries know that thay have more depressed people, they can understand how to struggle with it.
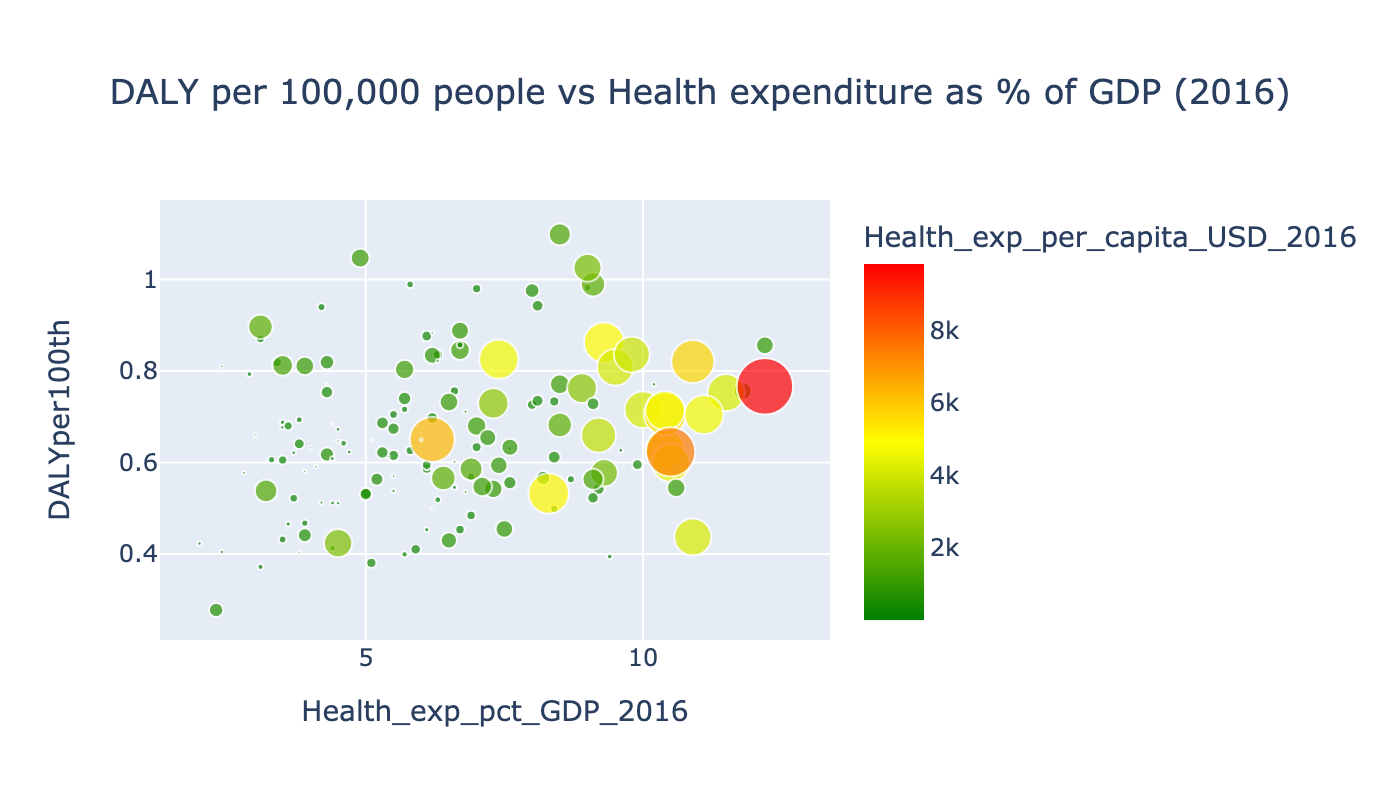
From the scatter plot of DALY per 100,000 people vs Depression rate we can conclude that most developed countries spent more money to health systems, have higher rate of depression, but because of they pay more attention to health sector, especially to mental health sector, they have less rate of DALY.

Conclusion
The following key thesises can be fomulated:
- First of all, depression is a widely distributed disorder worldwide, expecially in developed countries with high GDP per capita and high health expenditures per capita. This paradox can be explained by a large amount of attention to the disorder and higher rate of depression diagnostics. This is why countires with higher expenditures for health have a higher rate of depression.
- The influence of depression on society and economy can be calculated in DALY per 100,000 and DALY is distributed worldwide not consistently.
- The higher expenditures are significant to the decrease of DALY per 100,000 people in such countries. We can conclude, that if any country spent high amount of money to health system, thay will have higher number of diagnosted depression, but the burden of depression for this economy and society will be compensated.
- Beds in mental health hospitals per 100,000 people and the number of psyciatrists per 100,000 people are important to decrease both factors: the proportion of depression and DALY.
- Experience in diagnostics and treatment of some successful countries can be explored to be spread to the worldwide.
Considering the high prevalence and significance of depression, it is vital to explore effective treatment methods used as we will discuss in Northern European countries such as Denmark, Sweden, and Norway in the next section. Moreover, improved diagnostic methods are crucial in the effective management and treatment of depression. We will discuss a diagnostic method used in the USA to aid in modern diagnosis.
Gratitudes
I would like to special thank Dr. Tamer Jarada for the very useful feedback and great insights I received from his course and my project partners Shrivarshini Balaji and Niloofar Mirzadzare for productive cooperation, responsibility and excellent communication.
References
[1] World Health Organization. (2021). Depression. Retrieved from: https://www.who.int/news-room/fact-sheets/detail/depression
[2] Hidaka, B., H. (2012). Depression as a disease of modernity: explanations for increasing prevalence. Affect Disord. 140(3):205-14. doi: 10.1016/j.jad.2011.12.036.
[3] TheDevastator. (2022). Uncover global trends in mental health disorder. Kaggle. Retrieved from: https://www.kaggle.com/datasets/thedevastator/uncover-global-trends-in-mental-health-disorder
[4] Amit's datasets. data.world. (2022). Retrieved from: https://data.world/amitd
[5] World Health Organization. (2023). Global Health Estimates. World Health Organization. Retrieved from https://www.who.int/data/global-health-estimates
[6] World development indicators: The World Bank. World Development Indicators | The World Bank. (2017). Retrieved from: http://wdi.worldbank.org/table/2.12#
[7] World Health Organization. (2023). Government expenditures on mental health as a percentage of total government expenditures on Health (%). World Health Organization. Retrieved from: https://www.who.int/data/gho/data/indicators/indicator-details/GHO/government-expenditures-on-mental-health-as-a-percentage-of-total-government-expenditures-on-health-(-)
[8] Oberlander TF, Miller AR (2011). Antidepressant use in children and adolescents: Practice touch points to guide paediatricians. Paediatr Child Health.9:549-53. doi: 10.1093/pch/16.9.549. PMID: 23115493; PMCID: PMC3223889.
[9] Devastator, T. (2023). Antidepressant use in Scandinavia. Kaggle. Retrieved from: https://www.kaggle.com/datasets/thedevastator/antidepressant-use-in-scandinavia
[10] Liu, B., Chang, H., Peng, K., & Wang, X. (2022). An end-to-end depression recognition method based on EEGNet. Frontiers in Psychiatry, 13. https://doi.org/10.3389/fpsyt.2022.864393
[11] Allen JJ, Reznik SJ. (2015). Frontal EEG Asymmetry as a Promising Marker of Depression Vulnerability: Summary and Methodological Considerations. Curr Opin Psychol. 4:93-97. doi: 10.1016/j.copsyc.2014.12.017. Epub 2015 Jan 2. PMID: 26462291; PMCID: PMC4599354.
[12] Tiwari, S. (2022). Eeg Psychiatric Disorders Dataset. Kaggle. Retrieved from: https://www.kaggle.com/datasets/shashwatwork/eeg-psychiatric-disorders-dataset
[13] Lazygene. (2022). Visualising pre-processed EEG Data. Kaggle. Retrieved from https://www.kaggle.com/code/lazygene/visualising-pre-processed-eeg-data
[14] Čukić M, Stokić M, Simić S, Pokrajac D. (2020). The successful discrimination of depression from EEG could be attributed to proper feature extraction and not to a particular classification method. Cogn Neurodyn, 14(4):443-455. doi: 10.1007/s11571-020-09581-x. Epub 2020 Mar 25. PMID: 32655709; PMCID: PMC7334335.
[15] Lesbian, gay, bisexual, transgender and Queer/questioning. Psychiatry.org - Lesbian, Gay, Bisexual, Transgender and Queer/Questioning. (2023). Retrieved from https://www.psychiatry.org/psychiatrists/diversity/education/lgbtq-patients