Commodity Markets Dashboard
← Back
Dashboard
GitHub Repository
Commodity Price Analysis Dashboard using Dash App deployed to Azure Cloud
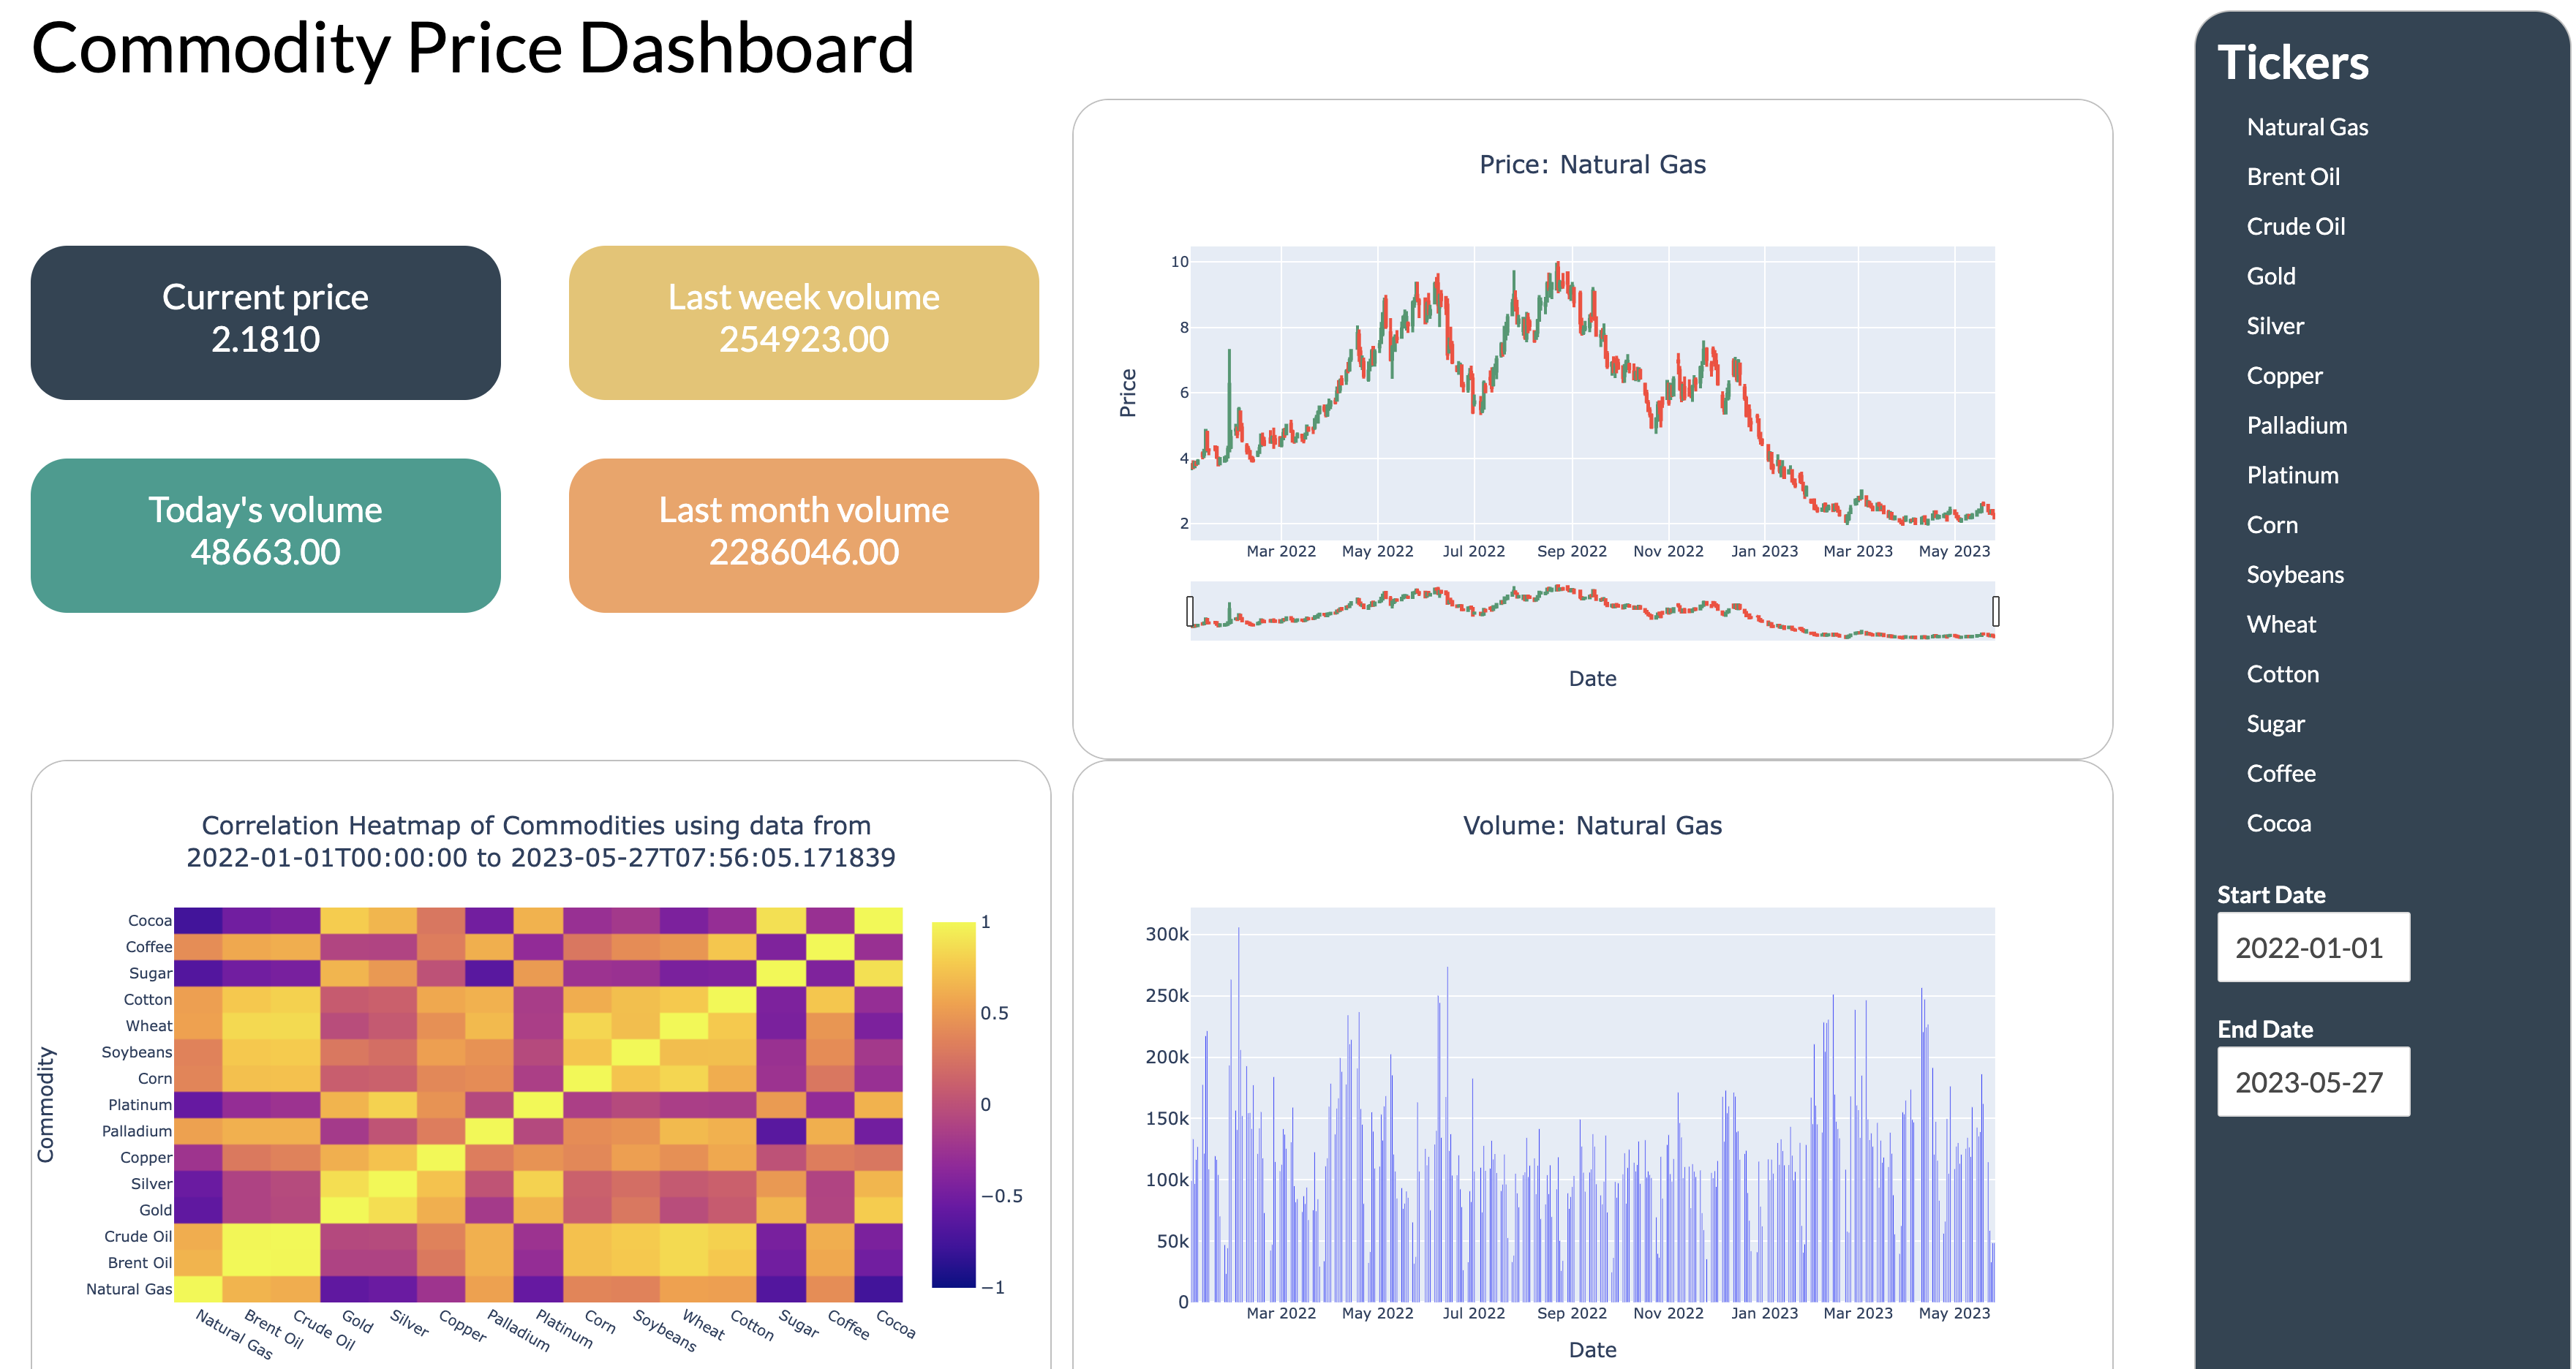
The Commodity Price Analysis Dashboard is a web application that provides visualizations and analysis of historical price data for various commodities. It fetches data from Yahoo Finance using the yfinance library and allows users to explore price trends, volume, and correlations between commodities.
Features
- Interactive Candlestick Charts: The dashboard displays candlestick charts that show the open, high, low, and close prices of selected commodities over a specified time period.
- Volume Charts: Users can view volume charts that represent the trading volume of selected commodities over time.
- Correlation Heatmap: The application generates a correlation heatmap that shows the correlation between different commodities based on their price movements.
- Date Range Selection: Users can select the start and end dates to specify the time range for data visualization.
- Ticker Selection: The dashboard allows users to select specific commodities from a dropdown menu to visualize their price data.
Technologies Used
- Python
- Dash: A Python framework for building analytical web applications.
- Plotly: A Python graphing library for interactive visualizations.
- Pandas: A data manipulation library for data analysis.
- Azure: Deployment app to Azure Cloud via GitHub
Installation
To install localy follow these steps:
Clone the repository:
Install the required dependencies:
pip install -r requirements.txtRun the app:
python app.pyOpen a web browser and go to http://localhost:8050 to access the dashboard
git clone https://https://github.com/orlovtsu/comm-dashboard.git
Deployment to Azure
To deploy the Commodity Price Analysis Dashboard to Azure, follow these steps:
Create an Azure account if you don't have one already.
Install the Azure CLI by following the instructions in the Azure CLI documentation.
Log in to your Azure account using the Azure CLI:
- Create a new Azure Web App:
- Set up deployment from a local Git repository:
- Add the Azure remote repository as a Git remote:
Push your local repository to the Azure remote:
git push azure masterWait for the deployment to finish. You can monitor the deployment status in the Azure portal or using the Azure CLI:
az webapp deployment list-publishing-credentials --name <app-name> --resource-group <resource-group-name>Once the deployment is complete, access the Commodity Price Analysis Dashboard by visiting https://
.azurewebsites.net in your web browser.
az login
az webapp create --name <app-name> --resource-group <resource-group-name> --plan <app-service-plan-name> --runtime "PYTHON|3.8"
Replace
az webapp deployment source config-local-git --name <app-name> --resource-group <resource-group-name>
git remote add azure <git-url-from-previous-step>
For detailed instructions on deploying a Dash application to Azure, refer to the official Dash deployment guide.
Usage
- Upon accessing the dashboard, you will see a left column displaying a list of available commodities and date range selectors.
- Select a commodity from the list by clicking on its name.
- Choose the start and end dates using the date pickers to define the time range for visualization.
- The main section of the dashboard will display candlestick charts, volume charts, and a correlation heatmap based on your selections.
- Explore the charts and heatmap by interacting with them. You can zoom in/out, pan, and hover over data points for additional information.
Data Source
The price data for the commodities is fetched from Yahoo Finance using the yfinance library. The data is downloaded and stored in a pandas DataFrame for visualization.
Credits
It is an open-source project. If you find any issues or have suggestions for improvements, please open an issue or submit a pull request
License
This project is licensed under the MIT License.
References
1. Yahoo Finance library for Python2. Dash Library for Python
3. Plotly Open Source Graphing Library for Python